[MT Trader] Backtest template w/ Supertrend Strategy---EN: In this strategy template you will find some functions already pre-programmed to be used in your strategies to speed up the programming process, among them we can highlight the default stop loss and take profit functions, which will help to set easily and quickly, defining the price range in which we want to prevent large losses or protect our profits from unexpected market movements.
🔴 Stop Loss: Among the functions of the stop loss are the 4 most known, first we have the fixed percentage range (%) and price ($), when the price reaches this fixed price will limit the losses of the operation avoiding larger losses, then we have the average true range (ATR), a moving average of true range and X period that can give us good reference points to place our stop loss, finally the last point higher or lower is the most used by traders to place their stop loss.
In addition, the price range between the entry and stop loss can be converted into a trailing stop loss.
🟢 Take Profit: We have 3 options for take profit, just like stop loss, the fixed range of percentage(%) and price($), are available, in addition to this we have the 1:# ratio option, which multiplies by X number the range between the entry and stop loss to use it as take profit, perfect for strategies that use ATR or last high/low point for their strategy.
📈 Heikin Ashi Entrys: The heikin ashi entries are trades that are calculated based on heikin ashi candles but their price is executed in Japanese candles, thus avoiding the false results that occur in heikin candlestick charts, making that in certain cases better results are obtained in the strategies that are executed with this option compared to Japanese candlesticks.
📊 Dashboard: A more visual and organized way to see the results and data needed for our strategy.
Feel free to use this template to program your own strategies, if you find bugs or want to request a new feature let me know in the comments or through my telegram @hvert_mt
__________________________________________________________________________________________________________________________________________________
---ES: En esta plantilla de estrategia podrás encontrar algunas funciones ya pre-programadas para ser usadas en tus estrategias para acelerar procesos de programación, entre ellas podemos destacar las funciones por defecto de stop loss y take profit, que ayudaran a establecer de manera fácil y rápida, definiendo los rango de precio en los que queremos prevenirnos de perdidas grandes o proteger nuestras ganancias de movimientos inesperados del mercado.
🔴 Stop Loss: Entre las funciones del stop loss están las 4 más conocidas, en primer lugar tenemos el rango de porcentaje fijo(%) y el precio($), cuando el precio alcance este precio fijo se limitaran las perdidas de la operación evitando perdidas mas grandes, después tenemos el promedio de rango verdadero(ATR), una media móvil del rango verdadero y X periodo que nos puede dar buenos puntos de referencia para colocar nuestro stop loss, por ultimo el ultimo punto mas alto o mas bajo es de los mas usados por los traders para colocar su stop loss.
Adicional a esto, el rango de precio entre la entrada y el stop loss se puede convertir en un trailing stop loss.
🟢 Take Profit: Tenemos 3 opciones para take profit, al igual que en el stop loss, el rango fijo de porcentaje(%) y precio($) se encuentran disponibles, adicional a esto tenemos la opción de ratio 1:#, que multiplica por X numero el rango entre la entrada y el stop loss para usarlo como take profit, perfecto para estrategias que usen ATR o ultimo punto alto/bajo.
📈 Entradas Heikin Ashi: Las entradas Heikin Ashi son trades que son calculados en base a las velas Aeikin Ashi pero su precio esta ejecutado a velas japonesas, evitando así los falsos resultados que se producen en graficas de velas Heikin, esto haciendo que en ciertos casos se obtengan mejores resultados en las estrategias que son ejecutadas con esta opción en comparación con las velas japonesas.
📊 Panel de Control: Una manera mas visual y organizada de ver los resultados y datos necesarios de nuestra estrategia.
Siéntete libre de usar esta plantilla para programar tus propias estrategias, si encuentras errores o quieres solicitar una nueva función házmelo saber en los comentarios o a través de mi Telegram: @hvert_mt
In den Scripts nach "the strat" suchen

Soren test 222Say we use strategy.risk.allow_entry_in() to only trade longs. When our script uses the strategy.entry() function to open a short trade, TradingView of course won’t allow our strategy to go short. But that doesn’t mean the trade is ignored. Instead the ‘enter short’ trade – which is actually a sell command – becomes an ‘exit long’ order.
Another way to think about this is the following. The strategy.entry() function can reverse positions: longs into shorts, and shorts into longs. That reverse behaviour gets stopped by strategy.risk.allow_entry_in(). What strategy.entry() instead ends doing is close positions: from long to flat, or from short to flat.
(The example strategies that we discuss later in this article show how strategy.risk.allow_entry_in() makes strategy.entry() close instead of open trades.)
# Can still trade both long or short
strategy.risk.allow_entry_in() can also allow our strategy to trade both long or short. That’s a bit silly, since this is already the default behaviour. But to cod

Strategy Table LibraryLibrary "table_library"
TODO: With this library, you can add tables to your strategies.
strategy_table()
Returns: Strategy Profit Table
Adds a table to the graph of the strategy for which you are calling the function. You can see data such as net profit in this table.
No parameters. Just call the function inside the strategy.
Example Code :
import only_fibonacci/table_lib/1 as st
st.strategy_table()

MilleMachineHello traders,
I hereby present to you the second stage of my journey to finding a reliable, profitable trading strategy.
The "Millemachine" is based on the "Millebot", my previous published strategy. This means the backbone of the strategy is still the same: a trend following system. Instead of using a fixed TP and SL, a trailing stoploss is now used. To limit the losses when the trend weakens, the trailing stoploss automatically gets smaller, as it is based on the ATR.
A new utility is you can now easily switch between indicators on which the decision making is based. This allows the user to discover which indicators work best for entry, long/short switching and stoploss configuration.
The strategy has been proven to be very profitable in trending markets, but can suffer losses during ranging market. To make the system more robust, the strategy cannot solely rely on a trending system. Other systems must be added.
I believe that a good trading bot must consist of more than 4 different strategies, based on different systems. This is what I am currently working on.
My goal for publishing this strategy is to help other traders build their own. In my journey I found it difficult to find a good strategy that employs a decent risk management, which is truly essential for having good, consistent results. Also, a realistic commission needs to be defined to have a realistic performance prediction. This weighs on the profitability and therefore is often set at 0 by authors of other strategies, which I find misleading.
If you have found this strategy informative or useful, please leave a comment.
Greetings Michael

Nasdaq VXN Volatility Warning IndicatorToday I am sharing with the community a volatility indicator that uses the Nasdaq VXN Volatility Index to help you or your algorithms avoid black swan events. This is a similar the indicator I published last week that uses the SP500 VIX, but this indicator uses the Nasdaq VXN and can help inform strategies on the Nasdaq index or Nasdaq derivative instruments.
Variance is most commonly used in statistics to derive standard deviation (with its square root). It does have another practical application, and that is to identify outliers in a sample of data. Variance is defined as the squared difference between a value and its mean. Calculating that squared difference means that the farther away the value is from the mean, the more the variance will grow (exponentially). This exponential difference makes outliers in the variance data more apparent.
Why does this matter?
There are assets or indices that exist in the stock market that might make us adjust our trading strategy if they are behaving in an unusual way. In some instances, we can use variance to identify that behavior and inform our strategy.
Is that really possible?
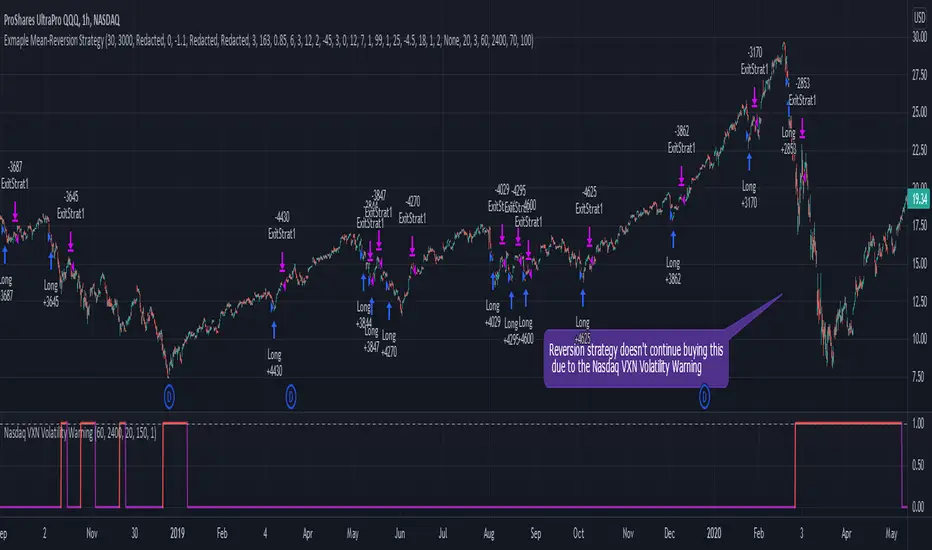
Let’s look at the relationship between VXN and the Nasdaq100 as an example. If you trade a Nasdaq index with a mean reversion strategy or algorithm, you know that they typically do best in times of volatility . These strategies essentially attempt to “call bottom” on a pullback. Their downside is that sometimes a pullback turns into a regime change, or a black swan event. The other downside is that there is no logical tight stop that actually increases their performance, so when they lose they tend to lose big.
So that begs the question, how might one quantitatively identify if this dip could turn into a regime change or black swan event?
The Nasdaq Volatility Index ( VXN ) uses options data to identify, on a large scale, what investors overall expect the market to do in the near future. The Volatility Index spikes in times of uncertainty and when investors expect the market to go down. However, during a black swan event, historically the VXN has spiked a lot harder. We can use variance here to identify if a spike in the VXN exceeds our threshold for a normal market pullback, and potentially avoid entering trades for a period of time (I.e. maybe we don’t buy that dip).
Does this actually work?
In backtesting, this cut the drawdown of my index reversion strategies in half. It also cuts out some good trades (because high investor fear isn’t always indicative of a regime change or black swan event). But, I’ll happily lose out on some good trades in exchange for half the drawdown. Lets look at some examples of periods of time that trades could have been avoided using this strategy/indicator:
Example 1 – With the Volatility Warning Indicator, the mean reversion strategy could have avoided repeatedly buying this pullback that led to this asset losing over 75% of its value:
Example 2 - June 2018 to June 2019 - With the Volatility Warning Indicator, the drawdown during this period reduces from 22% to 11%, and the overall returns increase from -8% to +3%
How do you use this indicator?
This indicator determines the variance of VXN against a long term mean. If the variance of the VXN spikes over an input threshold, the indicator goes up. The indicator will remain up for a defined period of bars/time after the variance returns below the threshold. I have included default values I’ve found to be significant for a short-term mean-reversion strategy, but your inputs might depend on your risk tolerance and strategy time-horizon. The default values are for 1hr VXN data/charts. It will pull in variance data for the VXN regardless of which chart the indicator is applied to.
Disclaimer: Open-source scripts I publish in the community are largely meant to spark ideas or be used as building blocks for part of a more robust trade management strategy. If you would like to implement a version of any script, I would recommend making significant additions/modifications to the strategy & risk management functions. If you don’t know how to program in Pine, then hire a Pine-coder. We can help!
[Sextan] T-Step LSMA MTF BacktestLevel: 1
NOTE: This is a request by @scantor516 to backtest T-Step LSMA by alexgrover with my Sextan framework. You can backtest many of my indicators in minutes now! Of course,you can define your own indicator in the highlighted area in compliance with the uniform format, which guarantee when you use "Indicator on Indicator" function, it would not produce any error.
Courtesy of alexgrover for his T-Step LSMA
Background
Backtesting of technical indicators and strategies is the most common way to understand a quantitative strategy. However, the complicated configuration and adaptation work of backtesting many quantitative tools makes many traders who do not understand the code daunted. Moreover, although I have written a lot of strategies, I am still not very satisfied with the backtest configuration and writing efficiency. Therefore, I have been thinking about how to build a backtesting framework that can quickly and easily evaluate the backtesting performance of any indicator with a "long/short entry" indicator, that is, a "simple backtesting tool for dummies". The performance requirements should be stable, and the operation should be simple and convenient. It is best to "copy", "paste", and "a few mouse clicks" to complete the quick backtest and evaluation of a new indicator.
Luckily, I recently realized that TradingView provides an "Indicator on Indicator" feature, which is the perfect foundation for doing "hot swap" backtesting. My basic idea is to use a two-layer design. The first layer is the technical indicator signal source that needs to be embedded, which is only used to provide buy and sell signals of custom strategies; the second layer is the trading system, which is used to receive the output signals of the first layer, and filter the signals according to the agreed specifications. , Take Profit, Stop Loss, draw buy and sell signals and cost lines, define and send custom buy and sell alert messages to mobile phones, social software or trading interfaces. In general, this two-layer design is a flexible combination of "death and alive", which can meet the needs of most traders to quickly evaluate the performance of a certain technical indicator. The first layer here is flexible. Users can insert their own strategy codes according to my template, and they can draw buy and sell signals and output them to the second layer. The second layer is fixed, and the overall framework is solidified to ensure the stability and unity of the trading system. It is convenient to compare different or similar strategies under the same conditions. Finally, all trading signals are drawn on the chart, and the output strategy returns. test report.
The main function:
The first layer: "{Sextan} Your Indicator Source", the script provides a template for personalized strategy input, and the signal and definition interfaces ensure full compatibility with the second layer. Backtesting is performed stably in the backtesting framework of the layer. The first layer of this script is also relatively simple: enter your script in the highlighted custom script area, and after ensuring the final buy and sell signals long = bool condition, short = bool condition, the design of the first layer is considered complete. Input it into the PINE script editor of TradingView, save it and add it to the chart, you can see the pulse sequence in yellow (buy) and purple (sell) on the sub-picture, corresponding to the main picture, you can subjectively judge that the quality of the trading point of the strategy is good Bad.
The second layer: "{Sextan} PINEv4 Sextans Backtest Framework". This script is the standardized trading system strategy execution and alarm, used to generate the final report of the strategy backtest and some key indicators that I have customized that I find useful, such as: winning rate , Odds, Winning Surface, Kelly Ratio, Take Profit and Stop Loss Thresholds, Trading Frequency, etc. are evaluated according to the Kelly formula. To use the second layer, first load it into the TrainingView chart, no markers will appear on the chart, since you have not specified any strategy source signals, click on the gear-shaped setting next to the "{Sextan} PINEv4 Sextans BTFW" header button, you can open the backtest settings, the first item is to select your custom strategy source. Because we have added the strategy source to the chart in the previous step, you can easily find an option "{Sextan} Your Indicator Source: Signal" at the bottom of the list, this is the strategy source input we need, select and confirm , you can see various markers on the main graph, and quickly generate a backtesting profit graph and a list of backtesting reports. You can generate files and download the backtesting reports locally. You can also click the gear on the backtest chart interface to customize some conditions of the backtest, including: initial capital amount, currency type, percentage of each order placed, amount of pyramid additions, commission fees, slippage, etc. configuration. Note: The configuration in the interface dialog overrides the same configuration implemented by the code in the backtest script.
How to output charts:
The first layer: "{Sextan} Your Indicator Source", the output of this script is the pulse value of yellow and purple, yellow +1 means buy, purple -1 means sell.
The second layer: PINEv4 Sextans Backtest Framework". The output of this script is a bit complicated. After all, it is the entire trading system with a lot of information:
1. Blue and red arrows. The blue upward arrow indicates long position, the red downward arrow indicates short position, and the horizontal bar at the end of the purple arrow indicates take profit or stop loss exit.
2. Red and green lines. This is the holding cost line of the strategy, green represents the cost of holding a long position, and red represents the cost of holding a short position. The cost line is a continuous solid line and the price action is relatively close.
3. Green and yellow long take profit and stop loss area and green and yellow long take profit and stop loss fork. Once a long position is held, there is a conditional order for take profit and stop loss. The green horizontal line is the long take profit ratio line, and the yellow is the long stop loss ratio line; the green cross indicates the long take profit price, and the yellow cross indicates the long position. Stop loss price. It's worth noting that the prongs and wires don't necessarily go together. Because of the optimization of the algorithm, for a strong market, the take profit will occur after breaking the take profit line, and the profit will not be taken until the price falls.
4. The purple and red short take profit and stop loss area and the purple red short stop loss fork. Once a short position is held, there will be a take profit and stop loss conditional order, the red is the short take profit ratio line, and the purple is the short stop loss ratio line; the red cross indicates the short take profit price, and the purple cross indicates the short stop loss price.
5. In addition to the above signs, there are also text and numbers indicating the profit and loss values of long and short positions. "L" means long; "S" means short; "XL" means close long; "XS" means close short.
TradingView Strategy Tester Panel:
The overview graph is an intuitive graph that plots the blue (gain) and red (loss) curves of all backtest periods together, and notes: the absolute value and percentage of net profit, the number of all closed positions, the winning percentage, the profit factor, The maximum trading loss, the absolute value and ratio of the average trading profit and loss, and the average number of K-lines held in all trades.
Another is the performance summary. This is to display all long and short statistical indicators of backtesting in the form of a list, such as: net profit, gross profit, Sharpe ratio, maximum position, commission, times of profit and loss, etc.
Finally, the transaction list is a table indexed by the transaction serial number, showing the signal direction, date and time, price, profit and loss, accumulated profit and loss, maximum transaction profit, transaction loss and other values.
Remarks
Finally, I will explain that this is just the beginning of this model. I will continue to optimize the trading system of the second layer. Various optimization feedback and suggestions are welcome. For valuable feedback, I am willing to provide some L4/L5 technical indicators as rewards for free subscription rights.

[Sextan] %R Trend Exhaustion BacktestLevel: 1
NOTE: This is a request by @upslidedown to backtest %R Trend Exhaustion by upslidedown with my Sextan framework. You can backtest many of my indicators in minutes now! Of course,you can define your own indicator in the highlighted area in compliance with the uniform format, which guarantee when you use "Indicator on Indicator" function, it would not produce any error.
Courtesy of upslidedown for his %R Trend Exhaustionindicator
Background
Backtesting of technical indicators and strategies is the most common way to understand a quantitative strategy. However, the complicated configuration and adaptation work of backtesting many quantitative tools makes many traders who do not understand the code daunted. Moreover, although I have written a lot of strategies, I am still not very satisfied with the backtest configuration and writing efficiency. Therefore, I have been thinking about how to build a backtesting framework that can quickly and easily evaluate the backtesting performance of any indicator with a "long/short entry" indicator, that is, a "simple backtesting tool for dummies". The performance requirements should be stable, and the operation should be simple and convenient. It is best to "copy", "paste", and "a few mouse clicks" to complete the quick backtest and evaluation of a new indicator.
Luckily, I recently realized that TradingView provides an "Indicator on Indicator" feature, which is the perfect foundation for doing "hot swap" backtesting. My basic idea is to use a two-layer design. The first layer is the technical indicator signal source that needs to be embedded, which is only used to provide buy and sell signals of custom strategies; the second layer is the trading system, which is used to receive the output signals of the first layer, and filter the signals according to the agreed specifications. , Take Profit, Stop Loss, draw buy and sell signals and cost lines, define and send custom buy and sell alert messages to mobile phones, social software or trading interfaces. In general, this two-layer design is a flexible combination of "death and alive", which can meet the needs of most traders to quickly evaluate the performance of a certain technical indicator. The first layer here is flexible. Users can insert their own strategy codes according to my template, and they can draw buy and sell signals and output them to the second layer. The second layer is fixed, and the overall framework is solidified to ensure the stability and unity of the trading system. It is convenient to compare different or similar strategies under the same conditions. Finally, all trading signals are drawn on the chart, and the output strategy returns. test report.
The main function:
The first layer: "{Sextan} Your Indicator Source", the script provides a template for personalized strategy input, and the signal and definition interfaces ensure full compatibility with the second layer. Backtesting is performed stably in the backtesting framework of the layer. The first layer of this script is also relatively simple: enter your script in the highlighted custom script area, and after ensuring the final buy and sell signals long = bool condition, short = bool condition, the design of the first layer is considered complete. Input it into the PINE script editor of TradingView, save it and add it to the chart, you can see the pulse sequence in yellow (buy) and purple (sell) on the sub-picture, corresponding to the main picture, you can subjectively judge that the quality of the trading point of the strategy is good Bad.
The second layer: "{Sextan} PINEv4 Sextans Backtest Framework". This script is the standardized trading system strategy execution and alarm, used to generate the final report of the strategy backtest and some key indicators that I have customized that I find useful, such as: winning rate , Odds, Winning Surface, Kelly Ratio, Take Profit and Stop Loss Thresholds, Trading Frequency, etc. are evaluated according to the Kelly formula. To use the second layer, first load it into the TrainingView chart, no markers will appear on the chart, since you have not specified any strategy source signals, click on the gear-shaped setting next to the "{Sextan} PINEv4 Sextans BTFW" header button, you can open the backtest settings, the first item is to select your custom strategy source. Because we have added the strategy source to the chart in the previous step, you can easily find an option "{Sextan} Your Indicator Source: Signal" at the bottom of the list, this is the strategy source input we need, select and confirm , you can see various markers on the main graph, and quickly generate a backtesting profit graph and a list of backtesting reports. You can generate files and download the backtesting reports locally. You can also click the gear on the backtest chart interface to customize some conditions of the backtest, including: initial capital amount, currency type, percentage of each order placed, amount of pyramid additions, commission fees, slippage, etc. configuration. Note: The configuration in the interface dialog overrides the same configuration implemented by the code in the backtest script.
How to output charts:
The first layer: "{Sextan} Your Indicator Source", the output of this script is the pulse value of yellow and purple, yellow +1 means buy, purple -1 means sell.
The second layer: PINEv4 Sextans Backtest Framework". The output of this script is a bit complicated. After all, it is the entire trading system with a lot of information:
1. Blue and red arrows. The blue upward arrow indicates long position, the red downward arrow indicates short position, and the horizontal bar at the end of the purple arrow indicates take profit or stop loss exit.
2. Red and green lines. This is the holding cost line of the strategy, green represents the cost of holding a long position, and red represents the cost of holding a short position. The cost line is a continuous solid line and the price action is relatively close.
3. Green and yellow long take profit and stop loss area and green and yellow long take profit and stop loss fork. Once a long position is held, there is a conditional order for take profit and stop loss. The green horizontal line is the long take profit ratio line, and the yellow is the long stop loss ratio line; the green cross indicates the long take profit price, and the yellow cross indicates the long position. Stop loss price. It's worth noting that the prongs and wires don't necessarily go together. Because of the optimization of the algorithm, for a strong market, the take profit will occur after breaking the take profit line, and the profit will not be taken until the price falls.
4. The purple and red short take profit and stop loss area and the purple red short stop loss fork. Once a short position is held, there will be a take profit and stop loss conditional order, the red is the short take profit ratio line, and the purple is the short stop loss ratio line; the red cross indicates the short take profit price, and the purple cross indicates the short stop loss price.
5. In addition to the above signs, there are also text and numbers indicating the profit and loss values of long and short positions. "L" means long; "S" means short; "XL" means close long; "XS" means close short.
TradingView Strategy Tester Panel:
The overview graph is an intuitive graph that plots the blue (gain) and red (loss) curves of all backtest periods together, and notes: the absolute value and percentage of net profit, the number of all closed positions, the winning percentage, the profit factor, The maximum trading loss, the absolute value and ratio of the average trading profit and loss, and the average number of K-lines held in all trades.
Another is the performance summary. This is to display all long and short statistical indicators of backtesting in the form of a list, such as: net profit, gross profit, Sharpe ratio, maximum position, commission, times of profit and loss, etc.
Finally, the transaction list is a table indexed by the transaction serial number, showing the signal direction, date and time, price, profit and loss, accumulated profit and loss, maximum transaction profit, transaction loss and other values.
Remarks
Finally, I will explain that this is just the beginning of this model. I will continue to optimize the trading system of the second layer. Various optimization feedback and suggestions are welcome. For valuable feedback, I am willing to provide some L4/L5 technical indicators as rewards for free subscription rights.

[Sextan] Your Indicator Source PINE v5 MTFLevel: 1
NOTE1: As requested, this is a multiple time frame(MTF) version of input signal source, which enable you to backtest any indicator/strategy MTF with "{Sextan} PINEv4 Sextans Backtest Framework". Courtesy of cheatcountry for his request.security() wrapper in PINE v5 to avoid repainting caused by request.security() function.
NOTE2: Many request this indicator template to support PINE v5. Now, here it is .This is ONLY an PINE v5 EXAMPLE on HOW-TO produce a customized "{Sextan} PINEv4 Sextans Backtest Framework" (for bactest framework it does not need to be written by PINE v5)intput signal source, you can define your own indicator in the highlighted area in compliance with the uniform format, which guarantee when you use "Indicator on Indicator" function, it would not produce any error.
I use two simple moving average crossings to produce long and short entry signal with SMA3 and SMA8 in the example.
Background
Backtesting of technical indicators and strategies is the most common way to understand a quantitative strategy. However, the complicated configuration and adaptation work of backtesting many quantitative tools makes many traders who do not understand the code daunted. Moreover, although I have written a lot of strategies, I am still not very satisfied with the backtest configuration and writing efficiency. Therefore, I have been thinking about how to build a backtesting framework that can quickly and easily evaluate the backtesting performance of any indicator with a "long/short entry" indicator, that is, a "simple backtesting tool for dummies". The performance requirements should be stable, and the operation should be simple and convenient. It is best to "copy", "paste", and "a few mouse clicks" to complete the quick backtest and evaluation of a new indicator.
Luckily, I recently realized that TradingView provides an "Indicator on Indicator" feature, which is the perfect foundation for doing "hot swap" backtesting. My basic idea is to use a two-layer design. The first layer is the technical indicator signal source that needs to be embedded, which is only used to provide buy and sell signals of custom strategies; the second layer is the trading system, which is used to receive the output signals of the first layer, and filter the signals according to the agreed specifications. , Take Profit, Stop Loss, draw buy and sell signals and cost lines, define and send custom buy and sell alert messages to mobile phones, social software or trading interfaces. In general, this two-layer design is a flexible combination of "death and alive", which can meet the needs of most traders to quickly evaluate the performance of a certain technical indicator. The first layer here is flexible. Users can insert their own strategy codes according to my template, and they can draw buy and sell signals and output them to the second layer. The second layer is fixed, and the overall framework is solidified to ensure the stability and unity of the trading system. It is convenient to compare different or similar strategies under the same conditions. Finally, all trading signals are drawn on the chart, and the output strategy returns. test report.
The main function:
The first layer: "{Sextan} Your Indicator Source", the script provides a template for personalized strategy input, and the signal and definition interfaces ensure full compatibility with the second layer. Backtesting is performed stably in the backtesting framework of the layer. The first layer of this script is also relatively simple: enter your script in the highlighted custom script area, and after ensuring the final buy and sell signals long = bool condition, short = bool condition, the design of the first layer is considered complete. Input it into the PINE script editor of TradingView, save it and add it to the chart, you can see the pulse sequence in yellow (buy) and purple (sell) on the sub-picture, corresponding to the main picture, you can subjectively judge that the quality of the trading point of the strategy is good Bad.
The second layer: "{Sextan} PINEv4 Sextans Backtest Framework". This script is the standardized trading system strategy execution and alarm, used to generate the final report of the strategy backtest and some key indicators that I have customized that I find useful, such as: winning rate , Odds, Winning Surface, Kelly Ratio, Take Profit and Stop Loss Thresholds, Trading Frequency, etc. are evaluated according to the Kelly formula. To use the second layer, first load it into the TrainingView chart, no markers will appear on the chart, since you have not specified any strategy source signals, click on the gear-shaped setting next to the "{Sextan} PINEv4 Sextans BTFW" header button, you can open the backtest settings, the first item is to select your custom strategy source. Because we have added the strategy source to the chart in the previous step, you can easily find an option "{Sextan} Your Indicator Source: Signal" at the bottom of the list, this is the strategy source input we need, select and confirm , you can see various markers on the main graph, and quickly generate a backtesting profit graph and a list of backtesting reports. You can generate files and download the backtesting reports locally. You can also click the gear on the backtest chart interface to customize some conditions of the backtest, including: initial capital amount, currency type, percentage of each order placed, amount of pyramid additions, commission fees, slippage, etc. configuration. Note: The configuration in the interface dialog overrides the same configuration implemented by the code in the backtest script.
How to output charts:
The first layer: "{Sextan} Your Indicator Source", the output of this script is the pulse value of yellow and purple, yellow +1 means buy, purple -1 means sell.
The second layer: PINEv4 Sextans Backtest Framework". The output of this script is a bit complicated. After all, it is the entire trading system with a lot of information:
1. Blue and red arrows. The blue upward arrow indicates long position, the red downward arrow indicates short position, and the horizontal bar at the end of the purple arrow indicates take profit or stop loss exit.
2. Red and green lines. This is the holding cost line of the strategy, green represents the cost of holding a long position, and red represents the cost of holding a short position. The cost line is a continuous solid line and the price action is relatively close.
3. Green and yellow long take profit and stop loss area and green and yellow long take profit and stop loss fork. Once a long position is held, there is a conditional order for take profit and stop loss. The green horizontal line is the long take profit ratio line, and the yellow is the long stop loss ratio line; the green cross indicates the long take profit price, and the yellow cross indicates the long position. Stop loss price. It's worth noting that the prongs and wires don't necessarily go together. Because of the optimization of the algorithm, for a strong market, the take profit will occur after breaking the take profit line, and the profit will not be taken until the price falls.
4. The purple and red short take profit and stop loss area and the purple red short stop loss fork. Once a short position is held, there will be a take profit and stop loss conditional order, the red is the short take profit ratio line, and the purple is the short stop loss ratio line; the red cross indicates the short take profit price, and the purple cross indicates the short stop loss price.
5. In addition to the above signs, there are also text and numbers indicating the profit and loss values of long and short positions. "L" means long; "S" means short; "XL" means close long; "XS" means close short.
TradingView Strategy Tester Panel:
The overview graph is an intuitive graph that plots the blue (gain) and red (loss) curves of all backtest periods together, and notes: the absolute value and percentage of net profit, the number of all closed positions, the winning percentage, the profit factor, The maximum trading loss, the absolute value and ratio of the average trading profit and loss, and the average number of K-lines held in all trades.
Another is the performance summary. This is to display all long and short statistical indicators of backtesting in the form of a list, such as: net profit, gross profit, Sharpe ratio, maximum position, commission, times of profit and loss, etc.
Finally, the transaction list is a table indexed by the transaction serial number, showing the signal direction, date and time, price, profit and loss, accumulated profit and loss, maximum transaction profit, transaction loss and other values.
Remarks
Finally, I will explain that this is just the beginning of this model. I will continue to optimize the trading system of the second layer. Various optimization feedback and suggestions are welcome. For valuable feedback, I am willing to provide some L4/L5 technical indicators as rewards for free subscription rights.

[Sextan] Your Indicator Source PINE v4 MTFLevel: 1
NOTE1: As requested, this is a multiple time frame(MTF) version of input signal source, which enable you to backtest any indicator/strategy MTF with "{Sextan} PINEv4 Sextans Backtest Framework". Courtesy of cheatcountry for his security() wrapper to avoid repainting caused by security() function.
NOTE2: This is ONLY an EXAMPLE on HOW-TO produce a customized "{Sextan} PINEv4 Sextans Backtest Framework" intput signal source, you can define your own indicator in the highlighted area in compliance with the uniform format, which guarantee when you use "Indicator on Indicator" function, it would not produce any error.
I use two simple moving average crossings to produce long and short entry signal with SMA3 and SMA8 in the example.
Background
Backtesting of technical indicators and strategies is the most common way to understand a quantitative strategy. However, the complicated configuration and adaptation work of backtesting many quantitative tools makes many traders who do not understand the code daunted. Moreover, although I have written a lot of strategies, I am still not very satisfied with the backtest configuration and writing efficiency. Therefore, I have been thinking about how to build a backtesting framework that can quickly and easily evaluate the backtesting performance of any indicator with a "long/short entry" indicator, that is, a "simple backtesting tool for dummies". The performance requirements should be stable, and the operation should be simple and convenient. It is best to "copy", "paste", and "a few mouse clicks" to complete the quick backtest and evaluation of a new indicator.
Luckily, I recently realized that TradingView provides an "Indicator on Indicator" feature, which is the perfect foundation for doing "hot swap" backtesting. My basic idea is to use a two-layer design. The first layer is the technical indicator signal source that needs to be embedded, which is only used to provide buy and sell signals of custom strategies; the second layer is the trading system, which is used to receive the output signals of the first layer, and filter the signals according to the agreed specifications. , Take Profit, Stop Loss, draw buy and sell signals and cost lines, define and send custom buy and sell alert messages to mobile phones, social software or trading interfaces. In general, this two-layer design is a flexible combination of "death and alive", which can meet the needs of most traders to quickly evaluate the performance of a certain technical indicator. The first layer here is flexible. Users can insert their own strategy codes according to my template, and they can draw buy and sell signals and output them to the second layer. The second layer is fixed, and the overall framework is solidified to ensure the stability and unity of the trading system. It is convenient to compare different or similar strategies under the same conditions. Finally, all trading signals are drawn on the chart, and the output strategy returns. test report.
The main function:
The first layer: "{Sextan} Your Indicator Source", the script provides a template for personalized strategy input, and the signal and definition interfaces ensure full compatibility with the second layer. Backtesting is performed stably in the backtesting framework of the layer. The first layer of this script is also relatively simple: enter your script in the highlighted custom script area, and after ensuring the final buy and sell signals long = bool condition, short = bool condition, the design of the first layer is considered complete. Input it into the PINE script editor of TradingView, save it and add it to the chart, you can see the pulse sequence in yellow (buy) and purple (sell) on the sub-picture, corresponding to the main picture, you can subjectively judge that the quality of the trading point of the strategy is good Bad.
The second layer: "{Sextan} PINEv4 Sextans Backtest Framework". This script is the standardized trading system strategy execution and alarm, used to generate the final report of the strategy backtest and some key indicators that I have customized that I find useful, such as: winning rate , Odds, Winning Surface, Kelly Ratio, Take Profit and Stop Loss Thresholds, Trading Frequency, etc. are evaluated according to the Kelly formula. To use the second layer, first load it into the TrainingView chart, no markers will appear on the chart, since you have not specified any strategy source signals, click on the gear-shaped setting next to the "{Sextan} PINEv4 Sextans BTFW" header button, you can open the backtest settings, the first item is to select your custom strategy source. Because we have added the strategy source to the chart in the previous step, you can easily find an option "{Sextan} Your Indicator Source: Signal" at the bottom of the list, this is the strategy source input we need, select and confirm , you can see various markers on the main graph, and quickly generate a backtesting profit graph and a list of backtesting reports. You can generate files and download the backtesting reports locally. You can also click the gear on the backtest chart interface to customize some conditions of the backtest, including: initial capital amount, currency type, percentage of each order placed, amount of pyramid additions, commission fees, slippage, etc. configuration. Note: The configuration in the interface dialog overrides the same configuration implemented by the code in the backtest script.
How to output charts:
The first layer: "{Sextan} Your Indicator Source", the output of this script is the pulse value of yellow and purple, yellow +1 means buy, purple -1 means sell.
The second layer: PINEv4 Sextans Backtest Framework". The output of this script is a bit complicated. After all, it is the entire trading system with a lot of information:
1. Blue and red arrows. The blue upward arrow indicates long position, the red downward arrow indicates short position, and the horizontal bar at the end of the purple arrow indicates take profit or stop loss exit.
2. Red and green lines. This is the holding cost line of the strategy, green represents the cost of holding a long position, and red represents the cost of holding a short position. The cost line is a continuous solid line and the price action is relatively close.
3. Green and yellow long take profit and stop loss area and green and yellow long take profit and stop loss fork. Once a long position is held, there is a conditional order for take profit and stop loss. The green horizontal line is the long take profit ratio line, and the yellow is the long stop loss ratio line; the green cross indicates the long take profit price, and the yellow cross indicates the long position. Stop loss price. It's worth noting that the prongs and wires don't necessarily go together. Because of the optimization of the algorithm, for a strong market, the take profit will occur after breaking the take profit line, and the profit will not be taken until the price falls.
4. The purple and red short take profit and stop loss area and the purple red short stop loss fork. Once a short position is held, there will be a take profit and stop loss conditional order, the red is the short take profit ratio line, and the purple is the short stop loss ratio line; the red cross indicates the short take profit price, and the purple cross indicates the short stop loss price.
5. In addition to the above signs, there are also text and numbers indicating the profit and loss values of long and short positions. "L" means long; "S" means short; "XL" means close long; "XS" means close short.
TradingView Strategy Tester Panel:
The overview graph is an intuitive graph that plots the blue (gain) and red (loss) curves of all backtest periods together, and notes: the absolute value and percentage of net profit, the number of all closed positions, the winning percentage, the profit factor, The maximum trading loss, the absolute value and ratio of the average trading profit and loss, and the average number of K-lines held in all trades.
Another is the performance summary. This is to display all long and short statistical indicators of backtesting in the form of a list, such as: net profit, gross profit, Sharpe ratio, maximum position, commission, times of profit and loss, etc.
Finally, the transaction list is a table indexed by the transaction serial number, showing the signal direction, date and time, price, profit and loss, accumulated profit and loss, maximum transaction profit, transaction loss and other values.
Remarks
Finally, I will explain that this is just the beginning of this model. I will continue to optimize the trading system of the second layer. Various optimization feedback and suggestions are welcome. For valuable feedback, I am willing to provide some L4/L5 technical indicators as rewards for free subscription rights.

[Sextan] B-Xtrender BacktestLevel: 1
NOTE: This is a request by @scantor516 to backtest B-Xtrender @PuppyTherapy by QuantTherapy with my Sextan framework. You can backtest many of my indicators in minutes now! Of course,you can define your own indicator in the highlighted area in compliance with the uniform format, which guarantee when you use "Indicator on Indicator" function, it would not produce any error.
Courtesy of QuantTherapy for his B-Xtrender @PuppyTherapy
Background
Backtesting of technical indicators and strategies is the most common way to understand a quantitative strategy. However, the complicated configuration and adaptation work of backtesting many quantitative tools makes many traders who do not understand the code daunted. Moreover, although I have written a lot of strategies, I am still not very satisfied with the backtest configuration and writing efficiency. Therefore, I have been thinking about how to build a backtesting framework that can quickly and easily evaluate the backtesting performance of any indicator with a "long/short entry" indicator, that is, a "simple backtesting tool for dummies". The performance requirements should be stable, and the operation should be simple and convenient. It is best to "copy", "paste", and "a few mouse clicks" to complete the quick backtest and evaluation of a new indicator.
Luckily, I recently realized that TradingView provides an "Indicator on Indicator" feature, which is the perfect foundation for doing "hot swap" backtesting. My basic idea is to use a two-layer design. The first layer is the technical indicator signal source that needs to be embedded, which is only used to provide buy and sell signals of custom strategies; the second layer is the trading system, which is used to receive the output signals of the first layer, and filter the signals according to the agreed specifications. , Take Profit, Stop Loss, draw buy and sell signals and cost lines, define and send custom buy and sell alert messages to mobile phones, social software or trading interfaces. In general, this two-layer design is a flexible combination of "death and alive", which can meet the needs of most traders to quickly evaluate the performance of a certain technical indicator. The first layer here is flexible. Users can insert their own strategy codes according to my template, and they can draw buy and sell signals and output them to the second layer. The second layer is fixed, and the overall framework is solidified to ensure the stability and unity of the trading system. It is convenient to compare different or similar strategies under the same conditions. Finally, all trading signals are drawn on the chart, and the output strategy returns. test report.
The main function:
The first layer: "{Sextan} Your Indicator Source", the script provides a template for personalized strategy input, and the signal and definition interfaces ensure full compatibility with the second layer. Backtesting is performed stably in the backtesting framework of the layer. The first layer of this script is also relatively simple: enter your script in the highlighted custom script area, and after ensuring the final buy and sell signals long = bool condition, short = bool condition, the design of the first layer is considered complete. Input it into the PINE script editor of TradingView, save it and add it to the chart, you can see the pulse sequence in yellow (buy) and purple (sell) on the sub-picture, corresponding to the main picture, you can subjectively judge that the quality of the trading point of the strategy is good Bad.
The second layer: "{Sextan} PINEv4 Sextans Backtest Framework". This script is the standardized trading system strategy execution and alarm, used to generate the final report of the strategy backtest and some key indicators that I have customized that I find useful, such as: winning rate , Odds, Winning Surface, Kelly Ratio, Take Profit and Stop Loss Thresholds, Trading Frequency, etc. are evaluated according to the Kelly formula. To use the second layer, first load it into the TrainingView chart, no markers will appear on the chart, since you have not specified any strategy source signals, click on the gear-shaped setting next to the "{Sextan} PINEv4 Sextans BTFW" header button, you can open the backtest settings, the first item is to select your custom strategy source. Because we have added the strategy source to the chart in the previous step, you can easily find an option "{Sextan} Your Indicator Source: Signal" at the bottom of the list, this is the strategy source input we need, select and confirm , you can see various markers on the main graph, and quickly generate a backtesting profit graph and a list of backtesting reports. You can generate files and download the backtesting reports locally. You can also click the gear on the backtest chart interface to customize some conditions of the backtest, including: initial capital amount, currency type, percentage of each order placed, amount of pyramid additions, commission fees, slippage, etc. configuration. Note: The configuration in the interface dialog overrides the same configuration implemented by the code in the backtest script.
How to output charts:
The first layer: "{Sextan} Your Indicator Source", the output of this script is the pulse value of yellow and purple, yellow +1 means buy, purple -1 means sell.
The second layer: PINEv4 Sextans Backtest Framework". The output of this script is a bit complicated. After all, it is the entire trading system with a lot of information:
1. Blue and red arrows. The blue upward arrow indicates long position, the red downward arrow indicates short position, and the horizontal bar at the end of the purple arrow indicates take profit or stop loss exit.
2. Red and green lines. This is the holding cost line of the strategy, green represents the cost of holding a long position, and red represents the cost of holding a short position. The cost line is a continuous solid line and the price action is relatively close.
3. Green and yellow long take profit and stop loss area and green and yellow long take profit and stop loss fork. Once a long position is held, there is a conditional order for take profit and stop loss. The green horizontal line is the long take profit ratio line, and the yellow is the long stop loss ratio line; the green cross indicates the long take profit price, and the yellow cross indicates the long position. Stop loss price. It's worth noting that the prongs and wires don't necessarily go together. Because of the optimization of the algorithm, for a strong market, the take profit will occur after breaking the take profit line, and the profit will not be taken until the price falls.
4. The purple and red short take profit and stop loss area and the purple red short stop loss fork. Once a short position is held, there will be a take profit and stop loss conditional order, the red is the short take profit ratio line, and the purple is the short stop loss ratio line; the red cross indicates the short take profit price, and the purple cross indicates the short stop loss price.
5. In addition to the above signs, there are also text and numbers indicating the profit and loss values of long and short positions. "L" means long; "S" means short; "XL" means close long; "XS" means close short.
TradingView Strategy Tester Panel:
The overview graph is an intuitive graph that plots the blue (gain) and red (loss) curves of all backtest periods together, and notes: the absolute value and percentage of net profit, the number of all closed positions, the winning percentage, the profit factor, The maximum trading loss, the absolute value and ratio of the average trading profit and loss, and the average number of K-lines held in all trades.
Another is the performance summary. This is to display all long and short statistical indicators of backtesting in the form of a list, such as: net profit, gross profit, Sharpe ratio, maximum position, commission, times of profit and loss, etc.
Finally, the transaction list is a table indexed by the transaction serial number, showing the signal direction, date and time, price, profit and loss, accumulated profit and loss, maximum transaction profit, transaction loss and other values.
Remarks
Finally, I will explain that this is just the beginning of this model. I will continue to optimize the trading system of the second layer. Various optimization feedback and suggestions are welcome. For valuable feedback, I am willing to provide some L4/L5 technical indicators as rewards for free subscription rights.

[Sextan] Haos Vieual BacktestLevel: 1
NOTE: This is a request by @scantor516 to backtest Haos Visual @PuppyTherapy by QuantTherapy with my Sextan framework. You can backtest many of my indicators in minutes now! Of course,you can define your own indicator in the highlighted area in compliance with the uniform format, which guarantee when you use "Indicator on Indicator" function, it would not produce any error.
Courtesy of QuantTherapy for his Haos Visual @PuppyTherapy
Background
Backtesting of technical indicators and strategies is the most common way to understand a quantitative strategy. However, the complicated configuration and adaptation work of backtesting many quantitative tools makes many traders who do not understand the code daunted. Moreover, although I have written a lot of strategies, I am still not very satisfied with the backtest configuration and writing efficiency. Therefore, I have been thinking about how to build a backtesting framework that can quickly and easily evaluate the backtesting performance of any indicator with a "long/short entry" indicator, that is, a "simple backtesting tool for dummies". The performance requirements should be stable, and the operation should be simple and convenient. It is best to "copy", "paste", and "a few mouse clicks" to complete the quick backtest and evaluation of a new indicator.
Luckily, I recently realized that TradingView provides an "Indicator on Indicator" feature, which is the perfect foundation for doing "hot swap" backtesting. My basic idea is to use a two-layer design. The first layer is the technical indicator signal source that needs to be embedded, which is only used to provide buy and sell signals of custom strategies; the second layer is the trading system, which is used to receive the output signals of the first layer, and filter the signals according to the agreed specifications. , Take Profit, Stop Loss, draw buy and sell signals and cost lines, define and send custom buy and sell alert messages to mobile phones, social software or trading interfaces. In general, this two-layer design is a flexible combination of "death and alive", which can meet the needs of most traders to quickly evaluate the performance of a certain technical indicator. The first layer here is flexible. Users can insert their own strategy codes according to my template, and they can draw buy and sell signals and output them to the second layer. The second layer is fixed, and the overall framework is solidified to ensure the stability and unity of the trading system. It is convenient to compare different or similar strategies under the same conditions. Finally, all trading signals are drawn on the chart, and the output strategy returns. test report.
The main function:
The first layer: "{Sextan} Your Indicator Source", the script provides a template for personalized strategy input, and the signal and definition interfaces ensure full compatibility with the second layer. Backtesting is performed stably in the backtesting framework of the layer. The first layer of this script is also relatively simple: enter your script in the highlighted custom script area, and after ensuring the final buy and sell signals long = bool condition, short = bool condition, the design of the first layer is considered complete. Input it into the PINE script editor of TradingView, save it and add it to the chart, you can see the pulse sequence in yellow (buy) and purple (sell) on the sub-picture, corresponding to the main picture, you can subjectively judge that the quality of the trading point of the strategy is good Bad.
The second layer: "{Sextan} PINEv4 Sextans Backtest Framework". This script is the standardized trading system strategy execution and alarm, used to generate the final report of the strategy backtest and some key indicators that I have customized that I find useful, such as: winning rate , Odds, Winning Surface, Kelly Ratio, Take Profit and Stop Loss Thresholds, Trading Frequency, etc. are evaluated according to the Kelly formula. To use the second layer, first load it into the TrainingView chart, no markers will appear on the chart, since you have not specified any strategy source signals, click on the gear-shaped setting next to the "{Sextan} PINEv4 Sextans BTFW" header button, you can open the backtest settings, the first item is to select your custom strategy source. Because we have added the strategy source to the chart in the previous step, you can easily find an option "{Sextan} Your Indicator Source: Signal" at the bottom of the list, this is the strategy source input we need, select and confirm , you can see various markers on the main graph, and quickly generate a backtesting profit graph and a list of backtesting reports. You can generate files and download the backtesting reports locally. You can also click the gear on the backtest chart interface to customize some conditions of the backtest, including: initial capital amount, currency type, percentage of each order placed, amount of pyramid additions, commission fees, slippage, etc. configuration. Note: The configuration in the interface dialog overrides the same configuration implemented by the code in the backtest script.
How to output charts:
The first layer: "{Sextan} Your Indicator Source", the output of this script is the pulse value of yellow and purple, yellow +1 means buy, purple -1 means sell.
The second layer: PINEv4 Sextans Backtest Framework". The output of this script is a bit complicated. After all, it is the entire trading system with a lot of information:
1. Blue and red arrows. The blue upward arrow indicates long position, the red downward arrow indicates short position, and the horizontal bar at the end of the purple arrow indicates take profit or stop loss exit.
2. Red and green lines. This is the holding cost line of the strategy, green represents the cost of holding a long position, and red represents the cost of holding a short position. The cost line is a continuous solid line and the price action is relatively close.
3. Green and yellow long take profit and stop loss area and green and yellow long take profit and stop loss fork. Once a long position is held, there is a conditional order for take profit and stop loss. The green horizontal line is the long take profit ratio line, and the yellow is the long stop loss ratio line; the green cross indicates the long take profit price, and the yellow cross indicates the long position. Stop loss price. It's worth noting that the prongs and wires don't necessarily go together. Because of the optimization of the algorithm, for a strong market, the take profit will occur after breaking the take profit line, and the profit will not be taken until the price falls.
4. The purple and red short take profit and stop loss area and the purple red short stop loss fork. Once a short position is held, there will be a take profit and stop loss conditional order, the red is the short take profit ratio line, and the purple is the short stop loss ratio line; the red cross indicates the short take profit price, and the purple cross indicates the short stop loss price.
5. In addition to the above signs, there are also text and numbers indicating the profit and loss values of long and short positions. "L" means long; "S" means short; "XL" means close long; "XS" means close short.
TradingView Strategy Tester Panel:
The overview graph is an intuitive graph that plots the blue (gain) and red (loss) curves of all backtest periods together, and notes: the absolute value and percentage of net profit, the number of all closed positions, the winning percentage, the profit factor, The maximum trading loss, the absolute value and ratio of the average trading profit and loss, and the average number of K-lines held in all trades.
Another is the performance summary. This is to display all long and short statistical indicators of backtesting in the form of a list, such as: net profit, gross profit, Sharpe ratio, maximum position, commission, times of profit and loss, etc.
Finally, the transaction list is a table indexed by the transaction serial number, showing the signal direction, date and time, price, profit and loss, accumulated profit and loss, maximum transaction profit, transaction loss and other values.
Remarks
Finally, I will explain that this is just the beginning of this model. I will continue to optimize the trading system of the second layer. Various optimization feedback and suggestions are welcome. For valuable feedback, I am willing to provide some L4/L5 technical indicators as rewards for free subscription rights.

[Sextan] Delta-RSI Oscillator BacktestLevel: 1
NOTE: This is a request by @scantor516 to backtest Delta-RSI Oscillator by tbiktag with my Sextan framework. You can backtest many of my indicators in minutes now! Of course,you can define your own indicator in the highlighted area in compliance with the uniform format, which guarantee when you use "Indicator on Indicator" function, it would not produce any error.
Courtesy of tbiktag for his Delta-RSI Oscillator Strategy
Background
Backtesting of technical indicators and strategies is the most common way to understand a quantitative strategy. However, the complicated configuration and adaptation work of backtesting many quantitative tools makes many traders who do not understand the code daunted. Moreover, although I have written a lot of strategies, I am still not very satisfied with the backtest configuration and writing efficiency. Therefore, I have been thinking about how to build a backtesting framework that can quickly and easily evaluate the backtesting performance of any indicator with a "long/short entry" indicator, that is, a "simple backtesting tool for dummies". The performance requirements should be stable, and the operation should be simple and convenient. It is best to "copy", "paste", and "a few mouse clicks" to complete the quick backtest and evaluation of a new indicator.
Luckily, I recently realized that TradingView provides an "Indicator on Indicator" feature, which is the perfect foundation for doing "hot swap" backtesting. My basic idea is to use a two-layer design. The first layer is the technical indicator signal source that needs to be embedded, which is only used to provide buy and sell signals of custom strategies; the second layer is the trading system, which is used to receive the output signals of the first layer, and filter the signals according to the agreed specifications. , Take Profit, Stop Loss, draw buy and sell signals and cost lines, define and send custom buy and sell alert messages to mobile phones, social software or trading interfaces. In general, this two-layer design is a flexible combination of "death and alive", which can meet the needs of most traders to quickly evaluate the performance of a certain technical indicator. The first layer here is flexible. Users can insert their own strategy codes according to my template, and they can draw buy and sell signals and output them to the second layer. The second layer is fixed, and the overall framework is solidified to ensure the stability and unity of the trading system. It is convenient to compare different or similar strategies under the same conditions. Finally, all trading signals are drawn on the chart, and the output strategy returns. test report.
The main function:
The first layer: "{Sextan} Your Indicator Source", the script provides a template for personalized strategy input, and the signal and definition interfaces ensure full compatibility with the second layer. Backtesting is performed stably in the backtesting framework of the layer. The first layer of this script is also relatively simple: enter your script in the highlighted custom script area, and after ensuring the final buy and sell signals long = bool condition, short = bool condition, the design of the first layer is considered complete. Input it into the PINE script editor of TradingView, save it and add it to the chart, you can see the pulse sequence in yellow (buy) and purple (sell) on the sub-picture, corresponding to the main picture, you can subjectively judge that the quality of the trading point of the strategy is good Bad.
The second layer: "{Sextan} PINEv4 Sextans Backtest Framework". This script is the standardized trading system strategy execution and alarm, used to generate the final report of the strategy backtest and some key indicators that I have customized that I find useful, such as: winning rate , Odds, Winning Surface, Kelly Ratio, Take Profit and Stop Loss Thresholds, Trading Frequency, etc. are evaluated according to the Kelly formula. To use the second layer, first load it into the TrainingView chart, no markers will appear on the chart, since you have not specified any strategy source signals, click on the gear-shaped setting next to the "{Sextan} PINEv4 Sextans BTFW" header button, you can open the backtest settings, the first item is to select your custom strategy source. Because we have added the strategy source to the chart in the previous step, you can easily find an option "{Sextan} Your Indicator Source: Signal" at the bottom of the list, this is the strategy source input we need, select and confirm , you can see various markers on the main graph, and quickly generate a backtesting profit graph and a list of backtesting reports. You can generate files and download the backtesting reports locally. You can also click the gear on the backtest chart interface to customize some conditions of the backtest, including: initial capital amount, currency type, percentage of each order placed, amount of pyramid additions, commission fees, slippage, etc. configuration. Note: The configuration in the interface dialog overrides the same configuration implemented by the code in the backtest script.
How to output charts:
The first layer: "{Sextan} Your Indicator Source", the output of this script is the pulse value of yellow and purple, yellow +1 means buy, purple -1 means sell.
The second layer: PINEv4 Sextans Backtest Framework". The output of this script is a bit complicated. After all, it is the entire trading system with a lot of information:
1. Blue and red arrows. The blue upward arrow indicates long position, the red downward arrow indicates short position, and the horizontal bar at the end of the purple arrow indicates take profit or stop loss exit.
2. Red and green lines. This is the holding cost line of the strategy, green represents the cost of holding a long position, and red represents the cost of holding a short position. The cost line is a continuous solid line and the price action is relatively close.
3. Green and yellow long take profit and stop loss area and green and yellow long take profit and stop loss fork. Once a long position is held, there is a conditional order for take profit and stop loss. The green horizontal line is the long take profit ratio line, and the yellow is the long stop loss ratio line; the green cross indicates the long take profit price, and the yellow cross indicates the long position. Stop loss price. It's worth noting that the prongs and wires don't necessarily go together. Because of the optimization of the algorithm, for a strong market, the take profit will occur after breaking the take profit line, and the profit will not be taken until the price falls.
4. The purple and red short take profit and stop loss area and the purple red short stop loss fork. Once a short position is held, there will be a take profit and stop loss conditional order, the red is the short take profit ratio line, and the purple is the short stop loss ratio line; the red cross indicates the short take profit price, and the purple cross indicates the short stop loss price.
5. In addition to the above signs, there are also text and numbers indicating the profit and loss values of long and short positions. "L" means long; "S" means short; "XL" means close long; "XS" means close short.
TradingView Strategy Tester Panel:
The overview graph is an intuitive graph that plots the blue (gain) and red (loss) curves of all backtest periods together, and notes: the absolute value and percentage of net profit, the number of all closed positions, the winning percentage, the profit factor, The maximum trading loss, the absolute value and ratio of the average trading profit and loss, and the average number of K-lines held in all trades.
Another is the performance summary. This is to display all long and short statistical indicators of backtesting in the form of a list, such as: net profit, gross profit, Sharpe ratio, maximum position, commission, times of profit and loss, etc.
Finally, the transaction list is a table indexed by the transaction serial number, showing the signal direction, date and time, price, profit and loss, accumulated profit and loss, maximum transaction profit, transaction loss and other values.
Remarks
Finally, I will explain that this is just the beginning of this model. I will continue to optimize the trading system of the second layer. Various optimization feedback and suggestions are welcome. For valuable feedback, I am willing to provide some L4/L5 technical indicators as rewards for free subscription rights.

[Sextan] Supertrend - Ladder ATR BacktestLevel: 1
NOTE: This is a request by @upslidedown to backtest Supertrend - Ladder ATR by HeWhoMustNotBeNamed with my Sextan framework. You can backtest many of my indicators in minutes now! Of course,you can define your own indicator in the highlighted area in compliance with the uniform format, which guarantee when you use "Indicator on Indicator" function, it would not produce any error.
Courtesy of HeWhoMustNotBeNamed for his Supertrend - Ladder ATR indicator
Background
Backtesting of technical indicators and strategies is the most common way to understand a quantitative strategy. However, the complicated configuration and adaptation work of backtesting many quantitative tools makes many traders who do not understand the code daunted. Moreover, although I have written a lot of strategies, I am still not very satisfied with the backtest configuration and writing efficiency. Therefore, I have been thinking about how to build a backtesting framework that can quickly and easily evaluate the backtesting performance of any indicator with a "long/short entry" indicator, that is, a "simple backtesting tool for dummies". The performance requirements should be stable, and the operation should be simple and convenient. It is best to "copy", "paste", and "a few mouse clicks" to complete the quick backtest and evaluation of a new indicator.
Luckily, I recently realized that TradingView provides an "Indicator on Indicator" feature, which is the perfect foundation for doing "hot swap" backtesting. My basic idea is to use a two-layer design. The first layer is the technical indicator signal source that needs to be embedded, which is only used to provide buy and sell signals of custom strategies; the second layer is the trading system, which is used to receive the output signals of the first layer, and filter the signals according to the agreed specifications. , Take Profit, Stop Loss, draw buy and sell signals and cost lines, define and send custom buy and sell alert messages to mobile phones, social software or trading interfaces. In general, this two-layer design is a flexible combination of "death and alive", which can meet the needs of most traders to quickly evaluate the performance of a certain technical indicator. The first layer here is flexible. Users can insert their own strategy codes according to my template, and they can draw buy and sell signals and output them to the second layer. The second layer is fixed, and the overall framework is solidified to ensure the stability and unity of the trading system. It is convenient to compare different or similar strategies under the same conditions. Finally, all trading signals are drawn on the chart, and the output strategy returns. test report.
The main function:
The first layer: "{Sextan} Your Indicator Source", the script provides a template for personalized strategy input, and the signal and definition interfaces ensure full compatibility with the second layer. Backtesting is performed stably in the backtesting framework of the layer. The first layer of this script is also relatively simple: enter your script in the highlighted custom script area, and after ensuring the final buy and sell signals long = bool condition, short = bool condition, the design of the first layer is considered complete. Input it into the PINE script editor of TradingView, save it and add it to the chart, you can see the pulse sequence in yellow (buy) and purple (sell) on the sub-picture, corresponding to the main picture, you can subjectively judge that the quality of the trading point of the strategy is good Bad.
The second layer: "{Sextan} PINEv4 Sextans Backtest Framework". This script is the standardized trading system strategy execution and alarm, used to generate the final report of the strategy backtest and some key indicators that I have customized that I find useful, such as: winning rate , Odds, Winning Surface, Kelly Ratio, Take Profit and Stop Loss Thresholds, Trading Frequency, etc. are evaluated according to the Kelly formula. To use the second layer, first load it into the TrainingView chart, no markers will appear on the chart, since you have not specified any strategy source signals, click on the gear-shaped setting next to the "{Sextan} PINEv4 Sextans BTFW" header button, you can open the backtest settings, the first item is to select your custom strategy source. Because we have added the strategy source to the chart in the previous step, you can easily find an option "{Sextan} Your Indicator Source: Signal" at the bottom of the list, this is the strategy source input we need, select and confirm , you can see various markers on the main graph, and quickly generate a backtesting profit graph and a list of backtesting reports. You can generate files and download the backtesting reports locally. You can also click the gear on the backtest chart interface to customize some conditions of the backtest, including: initial capital amount, currency type, percentage of each order placed, amount of pyramid additions, commission fees, slippage, etc. configuration. Note: The configuration in the interface dialog overrides the same configuration implemented by the code in the backtest script.
How to output charts:
The first layer: "{Sextan} Your Indicator Source", the output of this script is the pulse value of yellow and purple, yellow +1 means buy, purple -1 means sell.
The second layer: PINEv4 Sextans Backtest Framework". The output of this script is a bit complicated. After all, it is the entire trading system with a lot of information:
1. Blue and red arrows. The blue upward arrow indicates long position, the red downward arrow indicates short position, and the horizontal bar at the end of the purple arrow indicates take profit or stop loss exit.
2. Red and green lines. This is the holding cost line of the strategy, green represents the cost of holding a long position, and red represents the cost of holding a short position. The cost line is a continuous solid line and the price action is relatively close.
3. Green and yellow long take profit and stop loss area and green and yellow long take profit and stop loss fork. Once a long position is held, there is a conditional order for take profit and stop loss. The green horizontal line is the long take profit ratio line, and the yellow is the long stop loss ratio line; the green cross indicates the long take profit price, and the yellow cross indicates the long position. Stop loss price. It's worth noting that the prongs and wires don't necessarily go together. Because of the optimization of the algorithm, for a strong market, the take profit will occur after breaking the take profit line, and the profit will not be taken until the price falls.
4. The purple and red short take profit and stop loss area and the purple red short stop loss fork. Once a short position is held, there will be a take profit and stop loss conditional order, the red is the short take profit ratio line, and the purple is the short stop loss ratio line; the red cross indicates the short take profit price, and the purple cross indicates the short stop loss price.
5. In addition to the above signs, there are also text and numbers indicating the profit and loss values of long and short positions. "L" means long; "S" means short; "XL" means close long; "XS" means close short.
TradingView Strategy Tester Panel:
The overview graph is an intuitive graph that plots the blue (gain) and red (loss) curves of all backtest periods together, and notes: the absolute value and percentage of net profit, the number of all closed positions, the winning percentage, the profit factor, The maximum trading loss, the absolute value and ratio of the average trading profit and loss, and the average number of K-lines held in all trades.
Another is the performance summary. This is to display all long and short statistical indicators of backtesting in the form of a list, such as: net profit, gross profit, Sharpe ratio, maximum position, commission, times of profit and loss, etc.
Finally, the transaction list is a table indexed by the transaction serial number, showing the signal direction, date and time, price, profit and loss, accumulated profit and loss, maximum transaction profit, transaction loss and other values.
Remarks
Finally, I will explain that this is just the beginning of this model. I will continue to optimize the trading system of the second layer. Various optimization feedback and suggestions are welcome. For valuable feedback, I am willing to provide some L4/L5 technical indicators as rewards for free subscription rights.

[Sextan] Your Indicator Source for PINE v5Level: 1
NOTE: Many request this indicator template to support PINE v5. Now, here it is .This is ONLY an PINE v5 EXAMPLE on HOW-TO produce a customized "{Sextan} PINEv4 Sextans Backtest Framework" (for bactest framework it does not need to be written by PINE v5)intput signal source, you can define your own indicator in the highlighted area in compliance with the uniform format, which guarantee when you use "Indicator on Indicator" function, it would not produce any error.
I use two simple moving average crossings to produce long and short entry signal with SMA3 and SMA8 in the example.
Background
Backtesting of technical indicators and strategies is the most common way to understand a quantitative strategy. However, the complicated configuration and adaptation work of backtesting many quantitative tools makes many traders who do not understand the code daunted. Moreover, although I have written a lot of strategies, I am still not very satisfied with the backtest configuration and writing efficiency. Therefore, I have been thinking about how to build a backtesting framework that can quickly and easily evaluate the backtesting performance of any indicator with a "long/short entry" indicator, that is, a "simple backtesting tool for dummies". The performance requirements should be stable, and the operation should be simple and convenient. It is best to "copy", "paste", and "a few mouse clicks" to complete the quick backtest and evaluation of a new indicator.
Luckily, I recently realized that TradingView provides an "Indicator on Indicator" feature, which is the perfect foundation for doing "hot swap" backtesting. My basic idea is to use a two-layer design. The first layer is the technical indicator signal source that needs to be embedded, which is only used to provide buy and sell signals of custom strategies; the second layer is the trading system, which is used to receive the output signals of the first layer, and filter the signals according to the agreed specifications. , Take Profit, Stop Loss, draw buy and sell signals and cost lines, define and send custom buy and sell alert messages to mobile phones, social software or trading interfaces. In general, this two-layer design is a flexible combination of "death and alive", which can meet the needs of most traders to quickly evaluate the performance of a certain technical indicator. The first layer here is flexible. Users can insert their own strategy codes according to my template, and they can draw buy and sell signals and output them to the second layer. The second layer is fixed, and the overall framework is solidified to ensure the stability and unity of the trading system. It is convenient to compare different or similar strategies under the same conditions. Finally, all trading signals are drawn on the chart, and the output strategy returns. test report.
The main function:
The first layer: "{Sextan} Your Indicator Source", the script provides a template for personalized strategy input, and the signal and definition interfaces ensure full compatibility with the second layer. Backtesting is performed stably in the backtesting framework of the layer. The first layer of this script is also relatively simple: enter your script in the highlighted custom script area, and after ensuring the final buy and sell signals long = bool condition, short = bool condition, the design of the first layer is considered complete. Input it into the PINE script editor of TradingView, save it and add it to the chart, you can see the pulse sequence in yellow (buy) and purple (sell) on the sub-picture, corresponding to the main picture, you can subjectively judge that the quality of the trading point of the strategy is good Bad.
The second layer: "{Sextan} PINEv4 Sextans Backtest Framework". This script is the standardized trading system strategy execution and alarm, used to generate the final report of the strategy backtest and some key indicators that I have customized that I find useful, such as: winning rate , Odds, Winning Surface, Kelly Ratio, Take Profit and Stop Loss Thresholds, Trading Frequency, etc. are evaluated according to the Kelly formula. To use the second layer, first load it into the TrainingView chart, no markers will appear on the chart, since you have not specified any strategy source signals, click on the gear-shaped setting next to the "{Sextan} PINEv4 Sextans BTFW" header button, you can open the backtest settings, the first item is to select your custom strategy source. Because we have added the strategy source to the chart in the previous step, you can easily find an option "{Sextan} Your Indicator Source: Signal" at the bottom of the list, this is the strategy source input we need, select and confirm , you can see various markers on the main graph, and quickly generate a backtesting profit graph and a list of backtesting reports. You can generate files and download the backtesting reports locally. You can also click the gear on the backtest chart interface to customize some conditions of the backtest, including: initial capital amount, currency type, percentage of each order placed, amount of pyramid additions, commission fees, slippage, etc. configuration. Note: The configuration in the interface dialog overrides the same configuration implemented by the code in the backtest script.
How to output charts:
The first layer: "{Sextan} Your Indicator Source", the output of this script is the pulse value of yellow and purple, yellow +1 means buy, purple -1 means sell.
The second layer: PINEv4 Sextans Backtest Framework". The output of this script is a bit complicated. After all, it is the entire trading system with a lot of information:
1. Blue and red arrows. The blue upward arrow indicates long position, the red downward arrow indicates short position, and the horizontal bar at the end of the purple arrow indicates take profit or stop loss exit.
2. Red and green lines. This is the holding cost line of the strategy, green represents the cost of holding a long position, and red represents the cost of holding a short position. The cost line is a continuous solid line and the price action is relatively close.
3. Green and yellow long take profit and stop loss area and green and yellow long take profit and stop loss fork. Once a long position is held, there is a conditional order for take profit and stop loss. The green horizontal line is the long take profit ratio line, and the yellow is the long stop loss ratio line; the green cross indicates the long take profit price, and the yellow cross indicates the long position. Stop loss price. It's worth noting that the prongs and wires don't necessarily go together. Because of the optimization of the algorithm, for a strong market, the take profit will occur after breaking the take profit line, and the profit will not be taken until the price falls.
4. The purple and red short take profit and stop loss area and the purple red short stop loss fork. Once a short position is held, there will be a take profit and stop loss conditional order, the red is the short take profit ratio line, and the purple is the short stop loss ratio line; the red cross indicates the short take profit price, and the purple cross indicates the short stop loss price.
5. In addition to the above signs, there are also text and numbers indicating the profit and loss values of long and short positions. "L" means long; "S" means short; "XL" means close long; "XS" means close short.
TradingView Strategy Tester Panel:
The overview graph is an intuitive graph that plots the blue (gain) and red (loss) curves of all backtest periods together, and notes: the absolute value and percentage of net profit, the number of all closed positions, the winning percentage, the profit factor, The maximum trading loss, the absolute value and ratio of the average trading profit and loss, and the average number of K-lines held in all trades.
Another is the performance summary. This is to display all long and short statistical indicators of backtesting in the form of a list, such as: net profit, gross profit, Sharpe ratio, maximum position, commission, times of profit and loss, etc.
Finally, the transaction list is a table indexed by the transaction serial number, showing the signal direction, date and time, price, profit and loss, accumulated profit and loss, maximum transaction profit, transaction loss and other values.
Remarks
Finally, I will explain that this is just the beginning of this model. I will continue to optimize the trading system of the second layer. Various optimization feedback and suggestions are welcome. For valuable feedback, I am willing to provide some L4/L5 technical indicators as rewards for free subscription rights.

[Sextan] Hull MA BacktestLevel: 1
NOTE: This is a request by @babaa to backtest Hull suite by InSilico with my Sextan framework. You can backtest many of my indicators in minutes now! Of course,you can define your own indicator in the highlighted area in compliance with the uniform format, which guarantee when you use "Indicator on Indicator" function, it would not produce any error.
Courtesy of InSilico for his Hull suite indicator
Background
Backtesting of technical indicators and strategies is the most common way to understand a quantitative strategy. However, the complicated configuration and adaptation work of backtesting many quantitative tools makes many traders who do not understand the code daunted. Moreover, although I have written a lot of strategies, I am still not very satisfied with the backtest configuration and writing efficiency. Therefore, I have been thinking about how to build a backtesting framework that can quickly and easily evaluate the backtesting performance of any indicator with a "long/short entry" indicator, that is, a "simple backtesting tool for dummies". The performance requirements should be stable, and the operation should be simple and convenient. It is best to "copy", "paste", and "a few mouse clicks" to complete the quick backtest and evaluation of a new indicator.
Luckily, I recently realized that TradingView provides an "Indicator on Indicator" feature, which is the perfect foundation for doing "hot swap" backtesting. My basic idea is to use a two-layer design. The first layer is the technical indicator signal source that needs to be embedded, which is only used to provide buy and sell signals of custom strategies; the second layer is the trading system, which is used to receive the output signals of the first layer, and filter the signals according to the agreed specifications. , Take Profit, Stop Loss, draw buy and sell signals and cost lines, define and send custom buy and sell alert messages to mobile phones, social software or trading interfaces. In general, this two-layer design is a flexible combination of "death and alive", which can meet the needs of most traders to quickly evaluate the performance of a certain technical indicator. The first layer here is flexible. Users can insert their own strategy codes according to my template, and they can draw buy and sell signals and output them to the second layer. The second layer is fixed, and the overall framework is solidified to ensure the stability and unity of the trading system. It is convenient to compare different or similar strategies under the same conditions. Finally, all trading signals are drawn on the chart, and the output strategy returns. test report.
The main function:
The first layer: "{Sextan} Your Indicator Source", the script provides a template for personalized strategy input, and the signal and definition interfaces ensure full compatibility with the second layer. Backtesting is performed stably in the backtesting framework of the layer. The first layer of this script is also relatively simple: enter your script in the highlighted custom script area, and after ensuring the final buy and sell signals long = bool condition, short = bool condition, the design of the first layer is considered complete. Input it into the PINE script editor of TradingView, save it and add it to the chart, you can see the pulse sequence in yellow (buy) and purple (sell) on the sub-picture, corresponding to the main picture, you can subjectively judge that the quality of the trading point of the strategy is good Bad.
The second layer: "{Sextan} PINEv4 Sextans Backtest Framework". This script is the standardized trading system strategy execution and alarm, used to generate the final report of the strategy backtest and some key indicators that I have customized that I find useful, such as: winning rate , Odds, Winning Surface, Kelly Ratio, Take Profit and Stop Loss Thresholds, Trading Frequency, etc. are evaluated according to the Kelly formula. To use the second layer, first load it into the TrainingView chart, no markers will appear on the chart, since you have not specified any strategy source signals, click on the gear-shaped setting next to the "{Sextan} PINEv4 Sextans BTFW" header button, you can open the backtest settings, the first item is to select your custom strategy source. Because we have added the strategy source to the chart in the previous step, you can easily find an option "{Sextan} Your Indicator Source: Signal" at the bottom of the list, this is the strategy source input we need, select and confirm , you can see various markers on the main graph, and quickly generate a backtesting profit graph and a list of backtesting reports. You can generate files and download the backtesting reports locally. You can also click the gear on the backtest chart interface to customize some conditions of the backtest, including: initial capital amount, currency type, percentage of each order placed, amount of pyramid additions, commission fees, slippage, etc. configuration. Note: The configuration in the interface dialog overrides the same configuration implemented by the code in the backtest script.
How to output charts:
The first layer: "{Sextan} Your Indicator Source", the output of this script is the pulse value of yellow and purple, yellow +1 means buy, purple -1 means sell.
The second layer: PINEv4 Sextans Backtest Framework". The output of this script is a bit complicated. After all, it is the entire trading system with a lot of information:
1. Blue and red arrows. The blue upward arrow indicates long position, the red downward arrow indicates short position, and the horizontal bar at the end of the purple arrow indicates take profit or stop loss exit.
2. Red and green lines. This is the holding cost line of the strategy, green represents the cost of holding a long position, and red represents the cost of holding a short position. The cost line is a continuous solid line and the price action is relatively close.
3. Green and yellow long take profit and stop loss area and green and yellow long take profit and stop loss fork. Once a long position is held, there is a conditional order for take profit and stop loss. The green horizontal line is the long take profit ratio line, and the yellow is the long stop loss ratio line; the green cross indicates the long take profit price, and the yellow cross indicates the long position. Stop loss price. It's worth noting that the prongs and wires don't necessarily go together. Because of the optimization of the algorithm, for a strong market, the take profit will occur after breaking the take profit line, and the profit will not be taken until the price falls.
4. The purple and red short take profit and stop loss area and the purple red short stop loss fork. Once a short position is held, there will be a take profit and stop loss conditional order, the red is the short take profit ratio line, and the purple is the short stop loss ratio line; the red cross indicates the short take profit price, and the purple cross indicates the short stop loss price.
5. In addition to the above signs, there are also text and numbers indicating the profit and loss values of long and short positions. "L" means long; "S" means short; "XL" means close long; "XS" means close short.
TradingView Strategy Tester Panel:
The overview graph is an intuitive graph that plots the blue (gain) and red (loss) curves of all backtest periods together, and notes: the absolute value and percentage of net profit, the number of all closed positions, the winning percentage, the profit factor, The maximum trading loss, the absolute value and ratio of the average trading profit and loss, and the average number of K-lines held in all trades.
Another is the performance summary. This is to display all long and short statistical indicators of backtesting in the form of a list, such as: net profit, gross profit, Sharpe ratio, maximum position, commission, times of profit and loss, etc.
Finally, the transaction list is a table indexed by the transaction serial number, showing the signal direction, date and time, price, profit and loss, accumulated profit and loss, maximum transaction profit, transaction loss and other values.
Remarks
Finally, I will explain that this is just the beginning of this model. I will continue to optimize the trading system of the second layer. Various optimization feedback and suggestions are welcome. For valuable feedback, I am willing to provide some L4/L5 technical indicators as rewards for free subscription rights.

[Sextan] Fisher Transform BacktestLevel: 1
NOTE: This is a request by @Uni_ve12se to backtest Ehlers Fisher Transform by cheatcountry with my Sextan framework. I ONLY take 5 minutes to perform it and how much time would you cost for this work? You can backtest many of my indicators in minutes now! Of course,you can define your own indicator in the highlighted area in compliance with the uniform format, which guarantee when you use "Indicator on Indicator" function, it would not produce any error.
Courtesy of cheatcountry for his Ehlers Fisher Transform indicator
Background
Backtesting of technical indicators and strategies is the most common way to understand a quantitative strategy. However, the complicated configuration and adaptation work of backtesting many quantitative tools makes many traders who do not understand the code daunted. Moreover, although I have written a lot of strategies, I am still not very satisfied with the backtest configuration and writing efficiency. Therefore, I have been thinking about how to build a backtesting framework that can quickly and easily evaluate the backtesting performance of any indicator with a "long/short entry" indicator, that is, a "simple backtesting tool for dummies". The performance requirements should be stable, and the operation should be simple and convenient. It is best to "copy", "paste", and "a few mouse clicks" to complete the quick backtest and evaluation of a new indicator.
Luckily, I recently realized that TradingView provides an "Indicator on Indicator" feature, which is the perfect foundation for doing "hot swap" backtesting. My basic idea is to use a two-layer design. The first layer is the technical indicator signal source that needs to be embedded, which is only used to provide buy and sell signals of custom strategies; the second layer is the trading system, which is used to receive the output signals of the first layer, and filter the signals according to the agreed specifications. , Take Profit, Stop Loss, draw buy and sell signals and cost lines, define and send custom buy and sell alert messages to mobile phones, social software or trading interfaces. In general, this two-layer design is a flexible combination of "death and alive", which can meet the needs of most traders to quickly evaluate the performance of a certain technical indicator. The first layer here is flexible. Users can insert their own strategy codes according to my template, and they can draw buy and sell signals and output them to the second layer. The second layer is fixed, and the overall framework is solidified to ensure the stability and unity of the trading system. It is convenient to compare different or similar strategies under the same conditions. Finally, all trading signals are drawn on the chart, and the output strategy returns. test report.
The main function:
The first layer: "{Sextan} Your Indicator Source", the script provides a template for personalized strategy input, and the signal and definition interfaces ensure full compatibility with the second layer. Backtesting is performed stably in the backtesting framework of the layer. The first layer of this script is also relatively simple: enter your script in the highlighted custom script area, and after ensuring the final buy and sell signals long = bool condition, short = bool condition, the design of the first layer is considered complete. Input it into the PINE script editor of TradingView, save it and add it to the chart, you can see the pulse sequence in yellow (buy) and purple (sell) on the sub-picture, corresponding to the main picture, you can subjectively judge that the quality of the trading point of the strategy is good Bad.
The second layer: "{Sextan} PINEv4 Sextans Backtest Framework". This script is the standardized trading system strategy execution and alarm, used to generate the final report of the strategy backtest and some key indicators that I have customized that I find useful, such as: winning rate , Odds, Winning Surface, Kelly Ratio, Take Profit and Stop Loss Thresholds, Trading Frequency, etc. are evaluated according to the Kelly formula. To use the second layer, first load it into the TrainingView chart, no markers will appear on the chart, since you have not specified any strategy source signals, click on the gear-shaped setting next to the "{Sextan} PINEv4 Sextans BTFW" header button, you can open the backtest settings, the first item is to select your custom strategy source. Because we have added the strategy source to the chart in the previous step, you can easily find an option "{Sextan} Your Indicator Source: Signal" at the bottom of the list, this is the strategy source input we need, select and confirm , you can see various markers on the main graph, and quickly generate a backtesting profit graph and a list of backtesting reports. You can generate files and download the backtesting reports locally. You can also click the gear on the backtest chart interface to customize some conditions of the backtest, including: initial capital amount, currency type, percentage of each order placed, amount of pyramid additions, commission fees, slippage, etc. configuration. Note: The configuration in the interface dialog overrides the same configuration implemented by the code in the backtest script.
How to output charts:
The first layer: "{Sextan} Your Indicator Source", the output of this script is the pulse value of yellow and purple, yellow +1 means buy, purple -1 means sell.
The second layer: PINEv4 Sextans Backtest Framework". The output of this script is a bit complicated. After all, it is the entire trading system with a lot of information:
1. Blue and red arrows. The blue upward arrow indicates long position, the red downward arrow indicates short position, and the horizontal bar at the end of the purple arrow indicates take profit or stop loss exit.
2. Red and green lines. This is the holding cost line of the strategy, green represents the cost of holding a long position, and red represents the cost of holding a short position. The cost line is a continuous solid line and the price action is relatively close.
3. Green and yellow long take profit and stop loss area and green and yellow long take profit and stop loss fork. Once a long position is held, there is a conditional order for take profit and stop loss. The green horizontal line is the long take profit ratio line, and the yellow is the long stop loss ratio line; the green cross indicates the long take profit price, and the yellow cross indicates the long position. Stop loss price. It's worth noting that the prongs and wires don't necessarily go together. Because of the optimization of the algorithm, for a strong market, the take profit will occur after breaking the take profit line, and the profit will not be taken until the price falls.
4. The purple and red short take profit and stop loss area and the purple red short stop loss fork. Once a short position is held, there will be a take profit and stop loss conditional order, the red is the short take profit ratio line, and the purple is the short stop loss ratio line; the red cross indicates the short take profit price, and the purple cross indicates the short stop loss price.
5. In addition to the above signs, there are also text and numbers indicating the profit and loss values of long and short positions. "L" means long; "S" means short; "XL" means close long; "XS" means close short.
TradingView Strategy Tester Panel:
The overview graph is an intuitive graph that plots the blue (gain) and red (loss) curves of all backtest periods together, and notes: the absolute value and percentage of net profit, the number of all closed positions, the winning percentage, the profit factor, The maximum trading loss, the absolute value and ratio of the average trading profit and loss, and the average number of K-lines held in all trades.
Another is the performance summary. This is to display all long and short statistical indicators of backtesting in the form of a list, such as: net profit, gross profit, Sharpe ratio, maximum position, commission, times of profit and loss, etc.
Finally, the transaction list is a table indexed by the transaction serial number, showing the signal direction, date and time, price, profit and loss, accumulated profit and loss, maximum transaction profit, transaction loss and other values.
Remarks
Finally, I will explain that this is just the beginning of this model. I will continue to optimize the trading system of the second layer. Various optimization feedback and suggestions are welcome. For valuable feedback, I am willing to provide some L4/L5 technical indicators as rewards for free subscription rights.

[Sextan] M-Oscillator BacktestLevel: 1
NOTE: This is a request by @scantor516 to backtest M-Oscillator by Mango2Juice with my Sextan framework. I ONLY take 5 minutes to perform it and how much time would you cost for this work?
Courtesy of Mango2Juice for M-Oscillator script.
You can backtest many of my indicators in minutes now! Of course,you can define your own indicator in the highlighted area in compliance with the uniform format, which guarantee when you use "Indicator on Indicator" function, it would not produce any error.
Background
Backtesting of technical indicators and strategies is the most common way to understand a quantitative strategy. However, the complicated configuration and adaptation work of backtesting many quantitative tools makes many traders who do not understand the code daunted. Moreover, although I have written a lot of strategies, I am still not very satisfied with the backtest configuration and writing efficiency. Therefore, I have been thinking about how to build a backtesting framework that can quickly and easily evaluate the backtesting performance of any indicator with a "long/short entry" indicator, that is, a "simple backtesting tool for dummies". The performance requirements should be stable, and the operation should be simple and convenient. It is best to "copy", "paste", and "a few mouse clicks" to complete the quick backtest and evaluation of a new indicator.
Luckily, I recently realized that TradingView provides an "Indicator on Indicator" feature, which is the perfect foundation for doing "hot swap" backtesting. My basic idea is to use a two-layer design. The first layer is the technical indicator signal source that needs to be embedded, which is only used to provide buy and sell signals of custom strategies; the second layer is the trading system, which is used to receive the output signals of the first layer, and filter the signals according to the agreed specifications. , Take Profit, Stop Loss, draw buy and sell signals and cost lines, define and send custom buy and sell alert messages to mobile phones, social software or trading interfaces. In general, this two-layer design is a flexible combination of "death and alive", which can meet the needs of most traders to quickly evaluate the performance of a certain technical indicator. The first layer here is flexible. Users can insert their own strategy codes according to my template, and they can draw buy and sell signals and output them to the second layer. The second layer is fixed, and the overall framework is solidified to ensure the stability and unity of the trading system. It is convenient to compare different or similar strategies under the same conditions. Finally, all trading signals are drawn on the chart, and the output strategy returns. test report.
The main function:
The first layer: "{Sextan} Your Indicator Source", the script provides a template for personalized strategy input, and the signal and definition interfaces ensure full compatibility with the second layer. Backtesting is performed stably in the backtesting framework of the layer. The first layer of this script is also relatively simple: enter your script in the highlighted custom script area, and after ensuring the final buy and sell signals long = bool condition, short = bool condition, the design of the first layer is considered complete. Input it into the PINE script editor of TradingView, save it and add it to the chart, you can see the pulse sequence in yellow (buy) and purple (sell) on the sub-picture, corresponding to the main picture, you can subjectively judge that the quality of the trading point of the strategy is good Bad.
The second layer: "{Sextan} PINEv4 Sextans Backtest Framework". This script is the standardized trading system strategy execution and alarm, used to generate the final report of the strategy backtest and some key indicators that I have customized that I find useful, such as: winning rate , Odds, Winning Surface, Kelly Ratio, Take Profit and Stop Loss Thresholds, Trading Frequency, etc. are evaluated according to the Kelly formula. To use the second layer, first load it into the TrainingView chart, no markers will appear on the chart, since you have not specified any strategy source signals, click on the gear-shaped setting next to the "{Sextan} PINEv4 Sextans BTFW" header button, you can open the backtest settings, the first item is to select your custom strategy source. Because we have added the strategy source to the chart in the previous step, you can easily find an option "{Sextan} Your Indicator Source: Signal" at the bottom of the list, this is the strategy source input we need, select and confirm , you can see various markers on the main graph, and quickly generate a backtesting profit graph and a list of backtesting reports. You can generate files and download the backtesting reports locally. You can also click the gear on the backtest chart interface to customize some conditions of the backtest, including: initial capital amount, currency type, percentage of each order placed, amount of pyramid additions, commission fees, slippage, etc. configuration. Note: The configuration in the interface dialog overrides the same configuration implemented by the code in the backtest script.
How to output charts:
The first layer: "{Sextan} Your Indicator Source", the output of this script is the pulse value of yellow and purple, yellow +1 means buy, purple -1 means sell.
The second layer: PINEv4 Sextans Backtest Framework". The output of this script is a bit complicated. After all, it is the entire trading system with a lot of information:
1. Blue and red arrows. The blue upward arrow indicates long position, the red downward arrow indicates short position, and the horizontal bar at the end of the purple arrow indicates take profit or stop loss exit.
2. Red and green lines. This is the holding cost line of the strategy, green represents the cost of holding a long position, and red represents the cost of holding a short position. The cost line is a continuous solid line and the price action is relatively close.
3. Green and yellow long take profit and stop loss area and green and yellow long take profit and stop loss fork. Once a long position is held, there is a conditional order for take profit and stop loss. The green horizontal line is the long take profit ratio line, and the yellow is the long stop loss ratio line; the green cross indicates the long take profit price, and the yellow cross indicates the long position. Stop loss price. It's worth noting that the prongs and wires don't necessarily go together. Because of the optimization of the algorithm, for a strong market, the take profit will occur after breaking the take profit line, and the profit will not be taken until the price falls.
4. The purple and red short take profit and stop loss area and the purple red short stop loss fork. Once a short position is held, there will be a take profit and stop loss conditional order, the red is the short take profit ratio line, and the purple is the short stop loss ratio line; the red cross indicates the short take profit price, and the purple cross indicates the short stop loss price.
5. In addition to the above signs, there are also text and numbers indicating the profit and loss values of long and short positions. "L" means long; "S" means short; "XL" means close long; "XS" means close short.
TradingView Strategy Tester Panel:
The overview graph is an intuitive graph that plots the blue (gain) and red (loss) curves of all backtest periods together, and notes: the absolute value and percentage of net profit, the number of all closed positions, the winning percentage, the profit factor, The maximum trading loss, the absolute value and ratio of the average trading profit and loss, and the average number of K-lines held in all trades.
Another is the performance summary. This is to display all long and short statistical indicators of backtesting in the form of a list, such as: net profit, gross profit, Sharpe ratio, maximum position, commission, times of profit and loss, etc.
Finally, the transaction list is a table indexed by the transaction serial number, showing the signal direction, date and time, price, profit and loss, accumulated profit and loss, maximum transaction profit, transaction loss and other values.
Remarks
Finally, I will explain that this is just the beginning of this model. I will continue to optimize the trading system of the second layer. Various optimization feedback and suggestions are welcome. For valuable feedback, I am willing to provide some L4/L5 technical indicators as rewards for free subscription rights.

[Sextan] KAMA BacktestLevel: 1
NOTE: This is ONLY an EXAMPLE on HOW-TO produce a customized "{Sextan} PINEv4 Sextans Backtest Framework" with intput signal source as my "{blackcat} L2 Perry Kaufman Adaptive MA (KAMA)" quickly and drawing on main chart. You can backtest many of my indicators in minutes now!
Of course,you can define your own indicator in the highlighted area in compliance with the uniform format, which guarantee when you use "Indicator on Indicator" function, it would not produce any error.
Background
Backtesting of technical indicators and strategies is the most common way to understand a quantitative strategy. However, the complicated configuration and adaptation work of backtesting many quantitative tools makes many traders who do not understand the code daunted. Moreover, although I have written a lot of strategies, I am still not very satisfied with the backtest configuration and writing efficiency. Therefore, I have been thinking about how to build a backtesting framework that can quickly and easily evaluate the backtesting performance of any indicator with a "long/short entry" indicator, that is, a "simple backtesting tool for dummies". The performance requirements should be stable, and the operation should be simple and convenient. It is best to "copy", "paste", and "a few mouse clicks" to complete the quick backtest and evaluation of a new indicator.
Luckily, I recently realized that TradingView provides an "Indicator on Indicator" feature, which is the perfect foundation for doing "hot swap" backtesting. My basic idea is to use a two-layer design. The first layer is the technical indicator signal source that needs to be embedded, which is only used to provide buy and sell signals of custom strategies; the second layer is the trading system, which is used to receive the output signals of the first layer, and filter the signals according to the agreed specifications. , Take Profit, Stop Loss, draw buy and sell signals and cost lines, define and send custom buy and sell alert messages to mobile phones, social software or trading interfaces. In general, this two-layer design is a flexible combination of "death and alive", which can meet the needs of most traders to quickly evaluate the performance of a certain technical indicator. The first layer here is flexible. Users can insert their own strategy codes according to my template, and they can draw buy and sell signals and output them to the second layer. The second layer is fixed, and the overall framework is solidified to ensure the stability and unity of the trading system. It is convenient to compare different or similar strategies under the same conditions. Finally, all trading signals are drawn on the chart, and the output strategy returns. test report.
The main function:
The first layer: "{Sextan} Your Indicator Source", the script provides a template for personalized strategy input, and the signal and definition interfaces ensure full compatibility with the second layer. Backtesting is performed stably in the backtesting framework of the layer. The first layer of this script is also relatively simple: enter your script in the highlighted custom script area, and after ensuring the final buy and sell signals long = bool condition, short = bool condition, the design of the first layer is considered complete. Input it into the PINE script editor of TradingView, save it and add it to the chart, you can see the pulse sequence in yellow (buy) and purple (sell) on the sub-picture, corresponding to the main picture, you can subjectively judge that the quality of the trading point of the strategy is good Bad.
The second layer: "{Sextan} PINEv4 Sextans Backtest Framework". This script is the standardized trading system strategy execution and alarm, used to generate the final report of the strategy backtest and some key indicators that I have customized that I find useful, such as: winning rate , Odds, Winning Surface, Kelly Ratio, Take Profit and Stop Loss Thresholds, Trading Frequency, etc. are evaluated according to the Kelly formula. To use the second layer, first load it into the TrainingView chart, no markers will appear on the chart, since you have not specified any strategy source signals, click on the gear-shaped setting next to the "{Sextan} PINEv4 Sextans BTFW" header button, you can open the backtest settings, the first item is to select your custom strategy source. Because we have added the strategy source to the chart in the previous step, you can easily find an option "{Sextan} Your Indicator Source: Signal" at the bottom of the list, this is the strategy source input we need, select and confirm , you can see various markers on the main graph, and quickly generate a backtesting profit graph and a list of backtesting reports. You can generate files and download the backtesting reports locally. You can also click the gear on the backtest chart interface to customize some conditions of the backtest, including: initial capital amount, currency type, percentage of each order placed, amount of pyramid additions, commission fees, slippage, etc. configuration. Note: The configuration in the interface dialog overrides the same configuration implemented by the code in the backtest script.
How to output charts:
The first layer: "{Sextan} Your Indicator Source", the output of this script is the pulse value of yellow and purple, yellow +1 means buy, purple -1 means sell.
The second layer: PINEv4 Sextans Backtest Framework". The output of this script is a bit complicated. After all, it is the entire trading system with a lot of information:
1. Blue and red arrows. The blue upward arrow indicates long position, the red downward arrow indicates short position, and the horizontal bar at the end of the purple arrow indicates take profit or stop loss exit.
2. Red and green lines. This is the holding cost line of the strategy, green represents the cost of holding a long position, and red represents the cost of holding a short position. The cost line is a continuous solid line and the price action is relatively close.
3. Green and yellow long take profit and stop loss area and green and yellow long take profit and stop loss fork. Once a long position is held, there is a conditional order for take profit and stop loss. The green horizontal line is the long take profit ratio line, and the yellow is the long stop loss ratio line; the green cross indicates the long take profit price, and the yellow cross indicates the long position. Stop loss price. It's worth noting that the prongs and wires don't necessarily go together. Because of the optimization of the algorithm, for a strong market, the take profit will occur after breaking the take profit line, and the profit will not be taken until the price falls.
4. The purple and red short take profit and stop loss area and the purple red short stop loss fork. Once a short position is held, there will be a take profit and stop loss conditional order, the red is the short take profit ratio line, and the purple is the short stop loss ratio line; the red cross indicates the short take profit price, and the purple cross indicates the short stop loss price.
5. In addition to the above signs, there are also text and numbers indicating the profit and loss values of long and short positions. "L" means long; "S" means short; "XL" means close long; "XS" means close short.
TradingView Strategy Tester Panel:
The overview graph is an intuitive graph that plots the blue (gain) and red (loss) curves of all backtest periods together, and notes: the absolute value and percentage of net profit, the number of all closed positions, the winning percentage, the profit factor, The maximum trading loss, the absolute value and ratio of the average trading profit and loss, and the average number of K-lines held in all trades.
Another is the performance summary. This is to display all long and short statistical indicators of backtesting in the form of a list, such as: net profit, gross profit, Sharpe ratio, maximum position, commission, times of profit and loss, etc.
Finally, the transaction list is a table indexed by the transaction serial number, showing the signal direction, date and time, price, profit and loss, accumulated profit and loss, maximum transaction profit, transaction loss and other values.
Remarks
Finally, I will explain that this is just the beginning of this model. I will continue to optimize the trading system of the second layer. Various optimization feedback and suggestions are welcome. For valuable feedback, I am willing to provide some L4/L5 technical indicators as rewards for free subscription rights.

[Sextan] Backtesting with L2 Reversal Labels as an input sourceLevel: 1
NOTE: This is ONLY an EXAMPLE on HOW-TO produce a customized "{Sextan} PINEv4 Sextans Backtest Framework" intput signal with "(blackcat) L2 Reversal Labels", and you can define your own indicator in the highlighted area in compliance with the uniform format, which guarantee when you use "Indicator on Indicator" function, it would not produce any error.
I use two simple moving average crossings to produce long and short entry signal with SMA3 and SMA8 in the example.
Background
Backtesting of technical indicators and strategies is the most common way to understand a quantitative strategy. However, the complicated configuration and adaptation work of backtesting many quantitative tools makes many traders who do not understand the code daunted. Moreover, although I have written a lot of strategies, I am still not very satisfied with the backtest configuration and writing efficiency. Therefore, I have been thinking about how to build a backtesting framework that can quickly and easily evaluate the backtesting performance of any indicator with a "long/short entry" indicator, that is, a "simple backtesting tool for dummies". The performance requirements should be stable, and the operation should be simple and convenient. It is best to "copy", "paste", and "a few mouse clicks" to complete the quick backtest and evaluation of a new indicator.
Luckily, I recently realized that TradingView provides an "Indicator on Indicator" feature, which is the perfect foundation for doing "hot swap" backtesting. My basic idea is to use a two-layer design. The first layer is the technical indicator signal source that needs to be embedded, which is only used to provide buy and sell signals of custom strategies; the second layer is the trading system, which is used to receive the output signals of the first layer, and filter the signals according to the agreed specifications. , Take Profit, Stop Loss, draw buy and sell signals and cost lines, define and send custom buy and sell alert messages to mobile phones, social software or trading interfaces. In general, this two-layer design is a flexible combination of "death and alive", which can meet the needs of most traders to quickly evaluate the performance of a certain technical indicator. The first layer here is flexible. Users can insert their own strategy codes according to my template, and they can draw buy and sell signals and output them to the second layer. The second layer is fixed, and the overall framework is solidified to ensure the stability and unity of the trading system. It is convenient to compare different or similar strategies under the same conditions. Finally, all trading signals are drawn on the chart, and the output strategy returns. test report.
The main function:
The first layer: "{Sextan} Your Indicator Source", the script provides a template for personalized strategy input, and the signal and definition interfaces ensure full compatibility with the second layer. Backtesting is performed stably in the backtesting framework of the layer. The first layer of this script is also relatively simple: enter your script in the highlighted custom script area, and after ensuring the final buy and sell signals long = bool condition, short = bool condition, the design of the first layer is considered complete. Input it into the PINE script editor of TradingView, save it and add it to the chart, you can see the pulse sequence in yellow (buy) and purple (sell) on the sub-picture, corresponding to the main picture, you can subjectively judge that the quality of the trading point of the strategy is good Bad.
The second layer: "{Sextan} PINEv4 Sextans Backtest Framework". This script is the standardized trading system strategy execution and alarm, used to generate the final report of the strategy backtest and some key indicators that I have customized that I find useful, such as: winning rate , Odds, Winning Surface, Kelly Ratio, Take Profit and Stop Loss Thresholds, Trading Frequency, etc. are evaluated according to the Kelly formula. To use the second layer, first load it into the TrainingView chart, no markers will appear on the chart, since you have not specified any strategy source signals, click on the gear-shaped setting next to the "{Sextan} PINEv4 Sextans BTFW" header button, you can open the backtest settings, the first item is to select your custom strategy source. Because we have added the strategy source to the chart in the previous step, you can easily find an option "{Sextan} Your Indicator Source: Signal" at the bottom of the list, this is the strategy source input we need, select and confirm , you can see various markers on the main graph, and quickly generate a backtesting profit graph and a list of backtesting reports. You can generate files and download the backtesting reports locally. You can also click the gear on the backtest chart interface to customize some conditions of the backtest, including: initial capital amount, currency type, percentage of each order placed, amount of pyramid additions, commission fees, slippage, etc. configuration. Note: The configuration in the interface dialog overrides the same configuration implemented by the code in the backtest script.
How to output charts:
The first layer: "{Sextan} Your Indicator Source", the output of this script is the pulse value of yellow and purple, yellow +1 means buy, purple -1 means sell.
The second layer: PINEv4 Sextans Backtest Framework". The output of this script is a bit complicated. After all, it is the entire trading system with a lot of information:
1. Blue and red arrows. The blue upward arrow indicates long position, the red downward arrow indicates short position, and the horizontal bar at the end of the purple arrow indicates take profit or stop loss exit.
2. Red and green lines. This is the holding cost line of the strategy, green represents the cost of holding a long position, and red represents the cost of holding a short position. The cost line is a continuous solid line and the price action is relatively close.
3. Green and yellow long take profit and stop loss area and green and yellow long take profit and stop loss fork. Once a long position is held, there is a conditional order for take profit and stop loss. The green horizontal line is the long take profit ratio line, and the yellow is the long stop loss ratio line; the green cross indicates the long take profit price, and the yellow cross indicates the long position. Stop loss price. It's worth noting that the prongs and wires don't necessarily go together. Because of the optimization of the algorithm, for a strong market, the take profit will occur after breaking the take profit line, and the profit will not be taken until the price falls.
4. The purple and red short take profit and stop loss area and the purple red short stop loss fork. Once a short position is held, there will be a take profit and stop loss conditional order, the red is the short take profit ratio line, and the purple is the short stop loss ratio line; the red cross indicates the short take profit price, and the purple cross indicates the short stop loss price.
5. In addition to the above signs, there are also text and numbers indicating the profit and loss values of long and short positions. "L" means long; "S" means short; "XL" means close long; "XS" means close short.
TradingView Strategy Tester Panel:
The overview graph is an intuitive graph that plots the blue (gain) and red (loss) curves of all backtest periods together, and notes: the absolute value and percentage of net profit, the number of all closed positions, the winning percentage, the profit factor, The maximum trading loss, the absolute value and ratio of the average trading profit and loss, and the average number of K-lines held in all trades.
Another is the performance summary. This is to display all long and short statistical indicators of backtesting in the form of a list, such as: net profit, gross profit, Sharpe ratio, maximum position, commission, times of profit and loss, etc.
Finally, the transaction list is a table indexed by the transaction serial number, showing the signal direction, date and time, price, profit and loss, accumulated profit and loss, maximum transaction profit, transaction loss and other values.
Remarks
Finally, I will explain that this is just the beginning of this model. I will continue to optimize the trading system of the second layer. Various optimization feedback and suggestions are welcome. For valuable feedback, I am willing to provide some L4/L5 technical indicators as rewards for free subscription rights.

[Sextan] Your Indicator SourceLevel: 1
NOTE: This is ONLY an EXAMPLE on HOW-TO produce a customized "{Sextan} PINEv4 Sextans Backtest Framework" intput signal source, you can define your own indicator in the highlighted area in compliance with the uniform format, which guarantee when you use "Indicator on Indicator" function, it would not produce any error.
I use two simple moving average crossings to produce long and short entry signal with SMA3 and SMA8 in the example.
Background
Backtesting of technical indicators and strategies is the most common way to understand a quantitative strategy. However, the complicated configuration and adaptation work of backtesting many quantitative tools makes many traders who do not understand the code daunted. Moreover, although I have written a lot of strategies, I am still not very satisfied with the backtest configuration and writing efficiency. Therefore, I have been thinking about how to build a backtesting framework that can quickly and easily evaluate the backtesting performance of any indicator with a "long/short entry" indicator, that is, a "simple backtesting tool for dummies". The performance requirements should be stable, and the operation should be simple and convenient. It is best to "copy", "paste", and "a few mouse clicks" to complete the quick backtest and evaluation of a new indicator.
Luckily, I recently realized that TradingView provides an "Indicator on Indicator" feature, which is the perfect foundation for doing "hot swap" backtesting. My basic idea is to use a two-layer design. The first layer is the technical indicator signal source that needs to be embedded, which is only used to provide buy and sell signals of custom strategies; the second layer is the trading system, which is used to receive the output signals of the first layer, and filter the signals according to the agreed specifications. , Take Profit, Stop Loss, draw buy and sell signals and cost lines, define and send custom buy and sell alert messages to mobile phones, social software or trading interfaces. In general, this two-layer design is a flexible combination of "death and alive", which can meet the needs of most traders to quickly evaluate the performance of a certain technical indicator. The first layer here is flexible. Users can insert their own strategy codes according to my template, and they can draw buy and sell signals and output them to the second layer. The second layer is fixed, and the overall framework is solidified to ensure the stability and unity of the trading system. It is convenient to compare different or similar strategies under the same conditions. Finally, all trading signals are drawn on the chart, and the output strategy returns. test report.
The main function:
The first layer: "{Sextan} Your Indicator Source", the script provides a template for personalized strategy input, and the signal and definition interfaces ensure full compatibility with the second layer. Backtesting is performed stably in the backtesting framework of the layer. The first layer of this script is also relatively simple: enter your script in the highlighted custom script area, and after ensuring the final buy and sell signals long = bool condition, short = bool condition, the design of the first layer is considered complete. Input it into the PINE script editor of TradingView, save it and add it to the chart, you can see the pulse sequence in yellow (buy) and purple (sell) on the sub-picture, corresponding to the main picture, you can subjectively judge that the quality of the trading point of the strategy is good Bad.
The second layer: "{Sextan} PINEv4 Sextans Backtest Framework". This script is the standardized trading system strategy execution and alarm, used to generate the final report of the strategy backtest and some key indicators that I have customized that I find useful, such as: winning rate , Odds, Winning Surface, Kelly Ratio, Take Profit and Stop Loss Thresholds, Trading Frequency, etc. are evaluated according to the Kelly formula. To use the second layer, first load it into the TrainingView chart, no markers will appear on the chart, since you have not specified any strategy source signals, click on the gear-shaped setting next to the "{Sextan} PINEv4 Sextans BTFW" header button, you can open the backtest settings, the first item is to select your custom strategy source. Because we have added the strategy source to the chart in the previous step, you can easily find an option "{Sextan} Your Indicator Source: Signal" at the bottom of the list, this is the strategy source input we need, select and confirm , you can see various markers on the main graph, and quickly generate a backtesting profit graph and a list of backtesting reports. You can generate files and download the backtesting reports locally. You can also click the gear on the backtest chart interface to customize some conditions of the backtest, including: initial capital amount, currency type, percentage of each order placed, amount of pyramid additions, commission fees, slippage, etc. configuration. Note: The configuration in the interface dialog overrides the same configuration implemented by the code in the backtest script.
How to output charts:
The first layer: "{Sextan} Your Indicator Source", the output of this script is the pulse value of yellow and purple, yellow +1 means buy, purple -1 means sell.
The second layer: PINEv4 Sextans Backtest Framework". The output of this script is a bit complicated. After all, it is the entire trading system with a lot of information:
1. Blue and red arrows. The blue upward arrow indicates long position, the red downward arrow indicates short position, and the horizontal bar at the end of the purple arrow indicates take profit or stop loss exit.
2. Red and green lines. This is the holding cost line of the strategy, green represents the cost of holding a long position, and red represents the cost of holding a short position. The cost line is a continuous solid line and the price action is relatively close.
3. Green and yellow long take profit and stop loss area and green and yellow long take profit and stop loss fork. Once a long position is held, there is a conditional order for take profit and stop loss. The green horizontal line is the long take profit ratio line, and the yellow is the long stop loss ratio line; the green cross indicates the long take profit price, and the yellow cross indicates the long position. Stop loss price. It's worth noting that the prongs and wires don't necessarily go together. Because of the optimization of the algorithm, for a strong market, the take profit will occur after breaking the take profit line, and the profit will not be taken until the price falls.
4. The purple and red short take profit and stop loss area and the purple red short stop loss fork. Once a short position is held, there will be a take profit and stop loss conditional order, the red is the short take profit ratio line, and the purple is the short stop loss ratio line; the red cross indicates the short take profit price, and the purple cross indicates the short stop loss price.
5. In addition to the above signs, there are also text and numbers indicating the profit and loss values of long and short positions. "L" means long; "S" means short; "XL" means close long; "XS" means close short.
TradingView Strategy Tester Panel:
The overview graph is an intuitive graph that plots the blue (gain) and red (loss) curves of all backtest periods together, and notes: the absolute value and percentage of net profit, the number of all closed positions, the winning percentage, the profit factor, The maximum trading loss, the absolute value and ratio of the average trading profit and loss, and the average number of K-lines held in all trades.
Another is the performance summary. This is to display all long and short statistical indicators of backtesting in the form of a list, such as: net profit, gross profit, Sharpe ratio, maximum position, commission, times of profit and loss, etc.
Finally, the transaction list is a table indexed by the transaction serial number, showing the signal direction, date and time, price, profit and loss, accumulated profit and loss, maximum transaction profit, transaction loss and other values.
Remarks
Finally, I will explain that this is just the beginning of this model. I will continue to optimize the trading system of the second layer. Various optimization feedback and suggestions are welcome. For valuable feedback, I am willing to provide some L4/L5 technical indicators as rewards for free subscription rights.

S&P500 VIX Volatility Warning IndicatorToday I am sharing with the community a volatility indicator that can help you or your algorithms avoid black swan events. Variance is most commonly used in statistics to derive standard deviation (with its square root). It does have another practical application, and that is to identify outliers in a sample of data. Variance in statistics is defined as the squared difference between a value and its mean. Calculating that squared difference means that the farther away the value is from the mean, the more the variance will grow (exponentially). This exponential difference makes outliers in the variance data more apparent.
Why does this matter?
There are assets or indices that exist in the stock market that might make us adjust our trading strategy if they are behaving in an unusual way. In some instances, we can use variance to identify that behavior and inform our strategy.
Is that really possible?
Let’s look at the relationship between VIX and the S&P500 as an example. If you trade an S&P500 index with a mean reversion strategy or algorithm, you know that they typically do best in times of volatility. These strategies essentially attempt to “call bottom” on a pullback. Their downside is that sometimes a pullback turns into a regime change, or a black swan event. The other downside is that there is no logical tight stop that actually increases their performance, so when they lose they tend to lose big.
So that begs the question, how might one quantitatively identify if this dip could turn into a regime change or black swan event?
The CBOE Volatility Index (VIX) uses options data to identify, on a large scale, what investors overall expect the market to do in the near future. The Volatility Index spikes in times of uncertainty and when investors expect the market to go down. However, during a black swan event, the VIX spikes a lot harder. We can use variance here to identify if a spike in the VIX exceeds our threshold for a normal market pullback, and potentially avoid entering trades for a period of time (I.e. maybe we don’t buy that dip).
Does this actually work?
In backtesting, this cut the drawdown of my index reversion strategies in half. It also cuts out some good trades (because high investor fear isn’t always indicative of a regime change or black swan event). But, I’ll happily lose out on some good trades in exchange for half the drawdown. Lets look at some examples of periods of time that trades could have been avoided using this strategy/indicator:
Example 1 – With the Volatility Warning Indicator, the mean reversion strategy could have avoided repeatedly buying this pullback that led to SPXL losing over 75% of its value:
Example 2 - June 2018 to June 2019 - With the Volatility Warning Indicator, the drawdown during this period reduces from 22% to 11%, and the overall returns increase from -8% to +3%
How do you use this indicator?
This indicator determines the variance of the VIX against a long term mean. If the variance of the VIX spikes over an input threshold, the indicator goes up. The indicator will remain up for a defined period of bars/time after the variance returns below the threshold. I have included default values I’ve found to be significant for a short-term mean-reversion strategy, but your inputs might depend on your risk tolerance and strategy time-horizon. The default values are for 1hr VIX data. It will pull in variance data for the VIX regardless of which chart the indicator is applied to.
Disclaimer : Open-source scripts I publish in the community are largely meant to spark ideas or be used as building blocks for part of a more robust trade management strategy. If you would like to implement a version of any script, I would recommend making significant additions/modifications to the strategy & risk management functions. If you don’t know how to program in Pine, then hire a Pine-coder. We can help!

A simple trading strategy for XTZ/EUR (December 2021)This is my current trading strategy for XTZ/EUR for this month of December.
It tries to avoid pumps/dumps (i.e. does not trade on big candles).
It always performs one order in each candle for the trading window of the rebalance bear/bull market indicator (check my profile for it).
It has alerts configured so that you can use it in your server/broker (just pass along the `{{strategy.order.alert_message}}` in the alert message, it will include a positive number of XTZ when to buy, or a negative number when to sell).
It does not repaint.
The amount of crypto and fiat in the portfolio can be configured in the cog.
It does not outperform buy/hold for the bull months.
Check the results in the Data Window of Trading View (please avoid the Strategy Tester, it has too many bugs and is not intended for out of the box strategies such a this one).
All code is open source.

Up/Down Strategy - ContrarianThis is a consecutive bar up/down strategy for going long when the short condition is met or going short when the long condition is met. This is known in trading as taking contrarian signals and is helpful when an asset can provide only losses with a given strategy. In theory taking the opposing trade should produce a profit. With this strategy you can specify how many bars down to enter long and how many bars up to enter short. It also has code to check and make sure the condition is still true when launching the official alert, which helps back testing and live results line up, however be sure to enter commission and slippage into the properties to accurately reflect profits. I added back testing date ranges to this so you can easily pull up and see back tested results for a certain date range. I also added a buy and sell messages, close messages and take profit/stop loss message fields in the properties so you can launch alerts that will work with automated trading services. Simply enter your messages into those fields in the properties and then when you create an alert enter {{strategy.order.alert_message}} into the alert body and it will dynamically pull in your buy and sell messages when it fires alerts. I also added time restriction so you can enter trades only during the time frame specified. You can change it to any time frame, such at 0930-1600. Set the time restriction field to empty by default since otherwise the strategy won't take all trades like normal. So to enable time restriction enter a time frame in the format 0000-0000. I also added the ability to check off a box that will close the open trade at the end of the time restriction. So if you set the time frame to 0930-1600 and check off to enable close trade at end of time frame then it will look to exit the trade at the close of the next bar.
